Moseidmoen
Moseidmoen (Vennesla) had 2,961 residents on 1 January 2026. 11% of residents were 67 or over, against 15% across the municipality, and 20% were under 16. From the area’s service centre, 48 everyday shops and services are within a 15-minute walk. The population has grown by 14% since 2020.
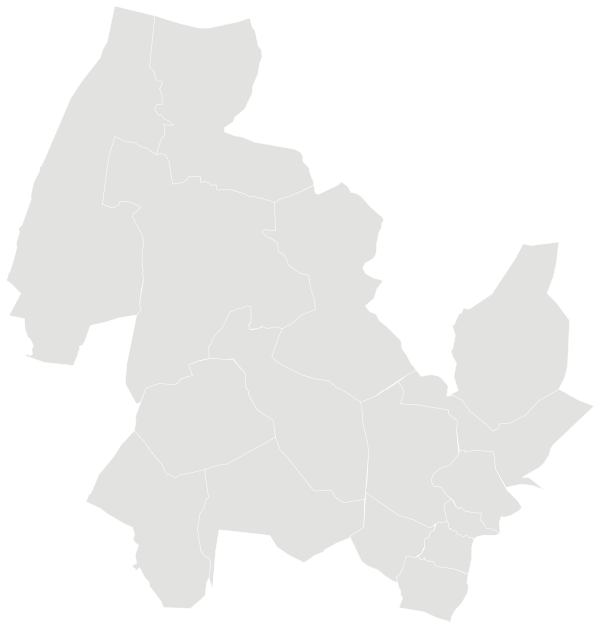
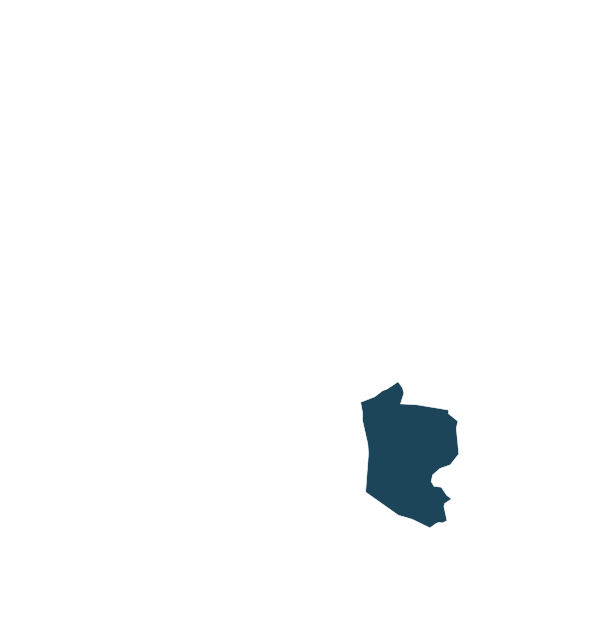
Sources: Statistics Norway (SSB), StatBank (CC BY 4.0) · © Norwegian Mapping Authority, basic statistical units (CC BY 4.0) · © OpenStreetMap contributors (ODbL)
People.
Age on 1 January 2026, next to the figure for Vennesla.
Population on 1 January
Basic statistical units (grunnkretser) are Statistics Norway’s smallest fixed areas. They usually follow housing estates, parts of towns and rural communities and have a few hundred residents. Income, house prices and education are not published for them; figures for the whole municipality are shown below.
Source: Statistics Norway (SSB), StatBank (CC BY 4.0)
The whole municipality.
Figures for Vennesla as a whole.
Source: Statistics Norway (SSB), StatBank (CC BY 4.0)
Everyday life.
48 everyday shops and services within a 15-minute walk; 8% green space within 500 metres.
Services and green space are measured from each area’s service centre: the point inside it with the most shops and services within 500 metres. District, municipal and county figures are averages weighted by population.
Source: © OpenStreetMap contributors (ODbL). Within one kilometre.
The neighbourhood in figures.
Moseidmoen and the nearest neighbourhoods in Vennesla, side by side. Colour shows where each sits among the others in the table.
| Neighbourhood | Residents | 67+ | Under 16 | Per km² | Green 500 m | Services 15 min |
|---|---|---|---|---|---|---|
| Eikeland | 571 | 20% | 23% | 11 | 44% | 7 |
| Eikelandsdalen | 654 | 12% | 21% | 43 | 62% | 1 |
| Føreland | 194 | 11% | 22% | 5 | 67% | 1 |
| Heisel-Lindekleiv | 461 | 18% | 18% | 62 | 53% | 15 |
| Hunsfoss | 1,526 | 7% | 21% | 748 | 17% | 43 |
| Ilebekk | 840 | 10% | 24% | 36 | 64% | 3 |
| Kile | 184 | 14% | 21% | 6 | 30% | 1 |
| Kvarstein | 694 | 14% | 20% | 113 | 50% | 8 |
| Moseidmoen | 2,961 | 11% | 20% | 165 | 8% | 48 |
Sources: Statistics Norway (SSB), StatBank (CC BY 4.0) · © OpenStreetMap contributors (ODbL)
More neighbourhoods in Vennesla.