United Kingdom
1,748,230 postcode reports across England, Wales and Scotland, each built from official and open data with the source and date under every figure. The median home sold for £295k over the last two years, from £175k in North East to £525k in London; 62% of households own their home and 87% of premises can get gigabit broadband.
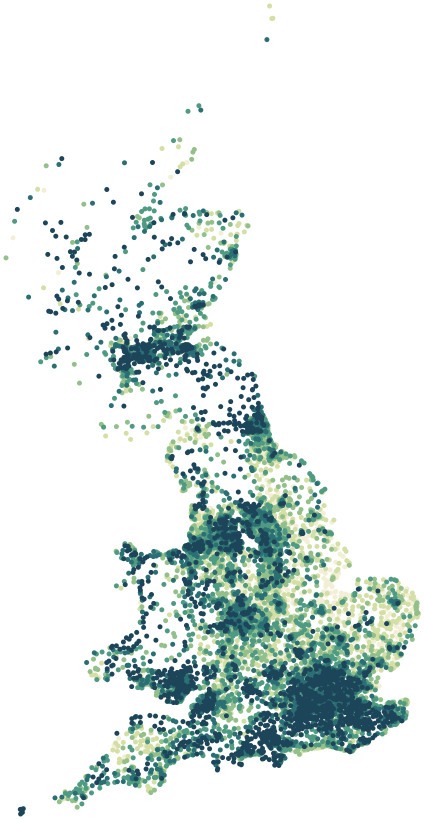
Map data © OpenStreetMap contributors · ONS Postcode Directory · HM Land Registry · IoD 2025 (England) · Ofcom Connected Nations
Regions.
Each region lists its local authorities; each local authority has maps, wards and every postcode.
| Region | Residents | Median price | Green 500 m | Gigabit | Local authorities | Postcodes |
|---|---|---|---|---|---|---|
| East Midlands | 4,880,058 | £250k | 13% | 89% | 35 | 121,477 |
| East of England | 6,335,074 | £349k | 16% | 85% | 45 | 172,043 |
| London | 8,799,728 | £525k | 14% | 91% | 33 | 180,965 |
| North East | 2,647,015 | £175k | 20% | 91% | 12 | 76,707 |
| North West | 7,417,416 | £225k | 16% | 91% | 35 | 199,705 |
| Scotland | 5,432,493 | – | 22% | 81% | 32 | 161,826 |
| South East | 9,278,067 | £384k | 21% | 85% | 64 | 261,178 |
| South West | 5,701,158 | £310k | 19% | 80% | 27 | 181,900 |
| Wales | 3,107,491 | £218k | 24% | 81% | 22 | 92,246 |
| West Midlands | 5,950,753 | £255k | 17% | 90% | 30 | 146,886 |
| Yorkshire and The Humber | 5,481,402 | £215k | 16% | 93% | 15 | 153,297 |
Sources: Census 2021 (ONS) · Scotland's Census 2022 (NRS) · HM Land Registry Price Paid Data, sales to 28 Aug 2026 · © OpenStreetMap contributors · Ofcom Connected Nations 2025
The largest places.
The 24 local authorities with the most residents. Each has maps, every ward and every postcode.
| Local authority | Residents | Median price | Owner-occupied | Green 500 m | Region |
|---|---|---|---|---|---|
| Birmingham | 1,144,919 | £240k | 53% | 16% | West Midlands |
| Leeds | 811,956 | £248k | 57% | 19% | Yorkshire and The Humber |
| North Yorkshire | 615,411 | £270k | 69% | 15% | Yorkshire and The Humber |
| Glasgow City | 615,266 | – | 47% | 19% | Scotland |
| Somerset | 571,526 | £285k | 67% | 25% | South West |
| Cornwall | 570,305 | £288k | 66% | 18% | South West |
| Sheffield | 556,820 | £220k | 58% | 21% | Yorkshire and The Humber |
| Buckinghamshire | 553,078 | £460k | 70% | 22% | South East |
| Manchester | 551,938 | £253k | 37% | 15% | North West |
| Bradford | 546,412 | £186k | 62% | 16% | Yorkshire and The Humber |
| County Durham | 522,068 | £145k | 63% | 21% | North East |
| City of Edinburgh | 514,024 | – | 60% | 32% | Scotland |
| Wiltshire | 510,333 | £320k | 67% | 19% | South West |
| Liverpool | 486,088 | £185k | 47% | 14% | North West |
| Bristol, City of | 472,465 | £350k | 54% | 17% | South West |
| Kirklees | 433,216 | £215k | 66% | 17% | Yorkshire and The Humber |
| West Northamptonshire | 425,725 | £300k | 65% | 16% | East Midlands |
| Bournemouth, Christchurch and Poole | 400,196 | £339k | 63% | 14% | South West |
| Cheshire East | 398,772 | £300k | 72% | 15% | North West |
| Croydon | 390,719 | £425k | 55% | 14% | London |
| Barnet | 389,344 | £575k | 53% | 18% | London |
| Dorset | 379,579 | £345k | 70% | 26% | South West |
| Fife | 371,816 | – | 65% | 21% | Scotland |
| Leicester | 368,571 | £244k | 47% | 13% | East Midlands |
In every postcode report.
The same blocks, in the same order, for each of the 1,748,230 postcodes. A block appears only where its data exists.
How each figure is calculated · Sources and licences · Cymru, yn Gymraeg
Coverage notes.
Northern Ireland postcodes are not included: the postcode directory's Northern Ireland data is licensed for internal use only. Scottish pages use Scotland's Census 2022, the Scottish Index of Multiple Deprivation 2020v2 and the Scottish Government school list; sale prices and street-level crime are not published as open data in Scotland. Flood likelihood in Scotland comes from SEPA's flood maps. Deprivation uses each nation's own index (England IoD 2025, Wales WIMD 2025, Scotland SIMD 2020v2), each ranked within its own nation. Schools come from the DfE register in England and the Welsh Government school list in Wales. Flood risk comes from the Environment Agency in England and Natural Resources Wales in Wales. Food hygiene ratings come from the Food Standards Agency, road collisions from the Department for Transport. Street-level crime is not published for Greater Manchester Police, and Gloucestershire Constabulary's latest months are missing, so those areas have no safety block.