Ullandhaug 2
Ullandhaug 2 (Stavanger) had 397 residents on 1 January 2026. 6% of residents were 67 or over, against 14% across the municipality, and 5% were under 16. From the area’s service centre, 100 everyday shops and services are within a 15-minute walk. The population has grown by 25% since 2016.
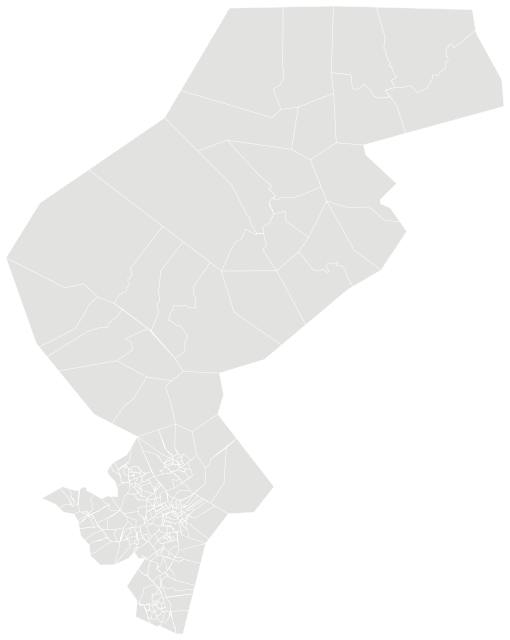

Sources: Statistics Norway (SSB), StatBank (CC BY 4.0) · © Norwegian Mapping Authority, basic statistical units (CC BY 4.0) · © OpenStreetMap contributors (ODbL)
People.
Age on 1 January 2026, next to the figure for Stavanger.
Population on 1 January
Basic statistical units (grunnkretser) are Statistics Norway’s smallest fixed areas. They usually follow housing estates, parts of towns and rural communities and have a few hundred residents. Income, house prices and education are not published for them; figures for the whole municipality are shown below.
Source: Statistics Norway (SSB), StatBank (CC BY 4.0)
The whole municipality.
Figures for Stavanger as a whole.
Source: Statistics Norway (SSB), StatBank (CC BY 4.0)
Everyday life.
100 everyday shops and services within a 15-minute walk; 19% green space within 500 metres.
Services and green space are measured from each area’s service centre: the point inside it with the most shops and services within 500 metres. District, municipal and county figures are averages weighted by population.
Source: © OpenStreetMap contributors (ODbL). Within one kilometre.
The neighbourhood in figures.
Ullandhaug 2 and the nearest neighbourhoods in Stavanger, side by side. Colour shows where each sits among the others in the table.
| Neighbourhood | Residents | 67+ | Under 16 | Per km² | Green 500 m | Services 15 min |
|---|---|---|---|---|---|---|
| Bekkefaret 1 | 166 | 16% | 20% | 3,320 | 10% | 223 |
| Bekkefaret 2 | 211 | 12% | 22% | 7,033 | 17% | 216 |
| Bekkefaret 3 | 956 | 7% | 26% | 9,560 | 12% | 232 |
| Bekkefaret 4 | 1,032 | 11% | 19% | 3,822 | 12% | 227 |
| Bekkefaret 5 | 611 | 11% | 20% | 1,797 | 20% | 173 |
| Bekkefaret 6 | 338 | 7% | 18% | 6,760 | 13% | 219 |
| Eikeberget | 1,514 | 20% | 14% | 4,092 | 6% | 156 |
| Eikeberget østre | 1,654 | 16% | 20% | 3,938 | 5% | 151 |
| Ullandhaug 2 | 397 | 6% | 5% | 328 | 19% | 100 |
Sources: Statistics Norway (SSB), StatBank (CC BY 4.0) · © OpenStreetMap contributors (ODbL)
More neighbourhoods in Hillevåg.