Nynäshamns stad-norra
Nynäshamns stad-norra (Nynäshamn) had 3,544 residents on 31 December 2025. Average net income for residents aged 20 and over was SEK 311,000 in 2024, 9% below the municipal average. The most common tenure was renting (hyresrätt), at 52% of homes. From the area’s service centre, 62 everyday shops and services are within a 15-minute walk.
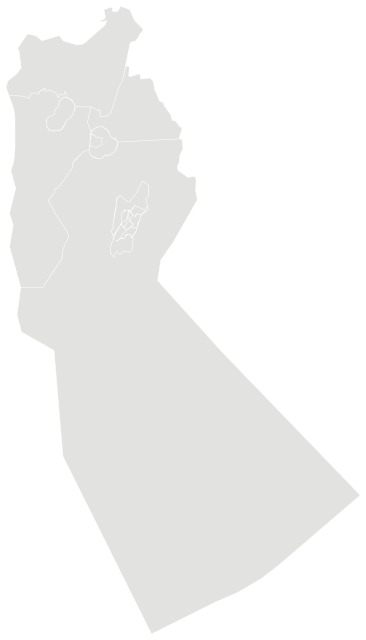

Sources: Statistics Sweden (SCB), Statistical Database (CC0) · Statistics Sweden, DeSO and RegSO 2025 boundaries (CC0) · © OpenStreetMap contributors (ODbL)
People.
Age and households on 31 December 2025, next to the figure for Nynäshamn.
1,804 households
Source: Statistics Sweden (SCB), Statistical Database (CC0)
Income and work.
Incomes and employment in 2024, from Statistics Sweden registers.
Education, aged 25–65
Net income is the sum of all taxable and tax-free income minus tax, for registered residents aged 20 and over, at 2024 prices.
Low economic standard means a household’s disposable income per consumption unit is below 60 per cent of the national median; high economic standard means it is more than twice the median. It describes incomes, not what an area is like to live in.
Employment and unemployment come from Statistics Sweden’s annual register of labour-market status and can differ from the Labour Force Survey.
Source: Statistics Sweden (SCB), Statistical Database (CC0)
Homes.
1,968 homes by tenure, 2025.
Source: Statistics Sweden (SCB), Statistical Database (CC0)
Everyday life.
62 everyday shops and services within a 15-minute walk; 10% green space within 500 metres.
Services and green space are measured from each DeSO area’s service centre: the point inside the area with the most shops and facilities within 500 metres. Larger areas show a population-weighted average.
Source: © OpenStreetMap contributors (ODbL). Within one kilometre.
More areas in Nynäshamn.