Arkansas
Arkansas has 3,049,391 residents in 75 counties and 550 ZIP codes. The median household income is $60,773, 25% below the national figure, and the typical owner-occupied home is valued at $188,000. 66% of households own their home.
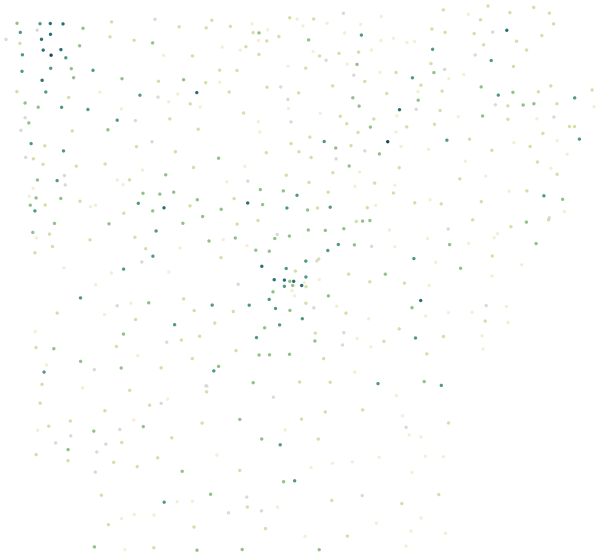
Sources: U.S. Census Bureau, American Community Survey 2020–2024 5-year estimates · U.S. Census Bureau, 2024 Gazetteer and 2020 ZCTA relationship files
All 75 counties.
Colour shows where each county sits among the others in the table, from lowest to highest.
| County | Residents | Household income | Home value | Owners | Bachelor's+ | Broadband | Commute |
|---|---|---|---|---|---|---|---|
| Arkansas County | 16,515 | $53K | $138K | 65% | 14% | 83% | 20 min |
| Ashley County | 18,429 | $44K | $92K | 71% | 13% | 80% | 26 min |
| Baxter County | 42,407 | $48K | $175K | 75% | 19% | 87% | 21 min |
| Benton County | 303,632 | $94K | $324K | 67% | 38% | 94% | 23 min |
| Boone County | 38,138 | $55K | $189K | 71% | 17% | 88% | 22 min |
| Bradley County | 10,208 | $41K | $95K | 66% | 15% | 80% | 25 min |
| Calhoun County | 4,704 | $67K | $111K | 88% | 20% | 84% | 28 min |
| Carroll County | 28,626 | $54K | $210K | 78% | 20% | 88% | 24 min |
| Chicot County | 9,765 | $39K | $89K | 69% | 18% | 80% | 21 min |
| Clark County | 21,125 | $52K | $155K | 65% | 26% | 84% | 22 min |
| Clay County | 14,280 | $51K | $95K | 75% | 15% | 82% | 25 min |
| Cleburne County | 25,226 | $56K | $180K | 81% | 18% | 84% | 28 min |
| Cleveland County | 7,453 | $55K | $138K | 83% | 20% | 79% | 30 min |
| Columbia County | 22,349 | $55K | $152K | 71% | 22% | 80% | 24 min |
| Conway County | 21,054 | $54K | $154K | 74% | 20% | 82% | 30 min |
| Craighead County | 113,249 | $60K | $210K | 60% | 30% | 88% | 21 min |
| Crawford County | 61,139 | $64K | $183K | 76% | 20% | 89% | 26 min |
| Crittenden County | 47,266 | $55K | $160K | 57% | 17% | 86% | 24 min |
| Cross County | 16,543 | $51K | $118K | 68% | 18% | 84% | 27 min |
| Dallas County | 6,242 | $43K | $97K | 73% | 11% | 74% | 26 min |
| Desha County | 10,786 | $38K | $91K | 57% | 13% | 78% | 22 min |
| Drew County | 17,046 | $43K | $141K | 64% | 26% | 81% | 23 min |
| Faulkner County | 127,717 | $67K | $233K | 62% | 35% | 93% | 28 min |
| Franklin County | 17,326 | $56K | $131K | 78% | 15% | 79% | 25 min |
| Fulton County | 12,302 | $42K | $114K | 85% | 16% | 77% | 30 min |
| Garland County | 100,035 | $57K | $194K | 69% | 25% | 85% | 23 min |
| Grant County | 18,242 | $72K | $162K | 81% | 22% | 89% | 33 min |
| Greene County | 46,432 | $58K | $169K | 66% | 17% | 87% | 24 min |
| Hempstead County | 19,508 | $47K | $106K | 72% | 16% | 76% | 23 min |
| Hot Spring County | 33,180 | $55K | $151K | 77% | 18% | 83% | 32 min |
| Howard County | 12,583 | $46K | $154K | 73% | 16% | 81% | 22 min |
| Independence County | 38,175 | $57K | $143K | 69% | 18% | 81% | 21 min |
| Izard County | 14,009 | $49K | $129K | 75% | 20% | 81% | 29 min |
| Jackson County | 16,712 | $44K | $98K | 66% | 15% | 83% | 21 min |
| Jefferson County | 64,802 | $51K | $113K | 62% | 20% | 83% | 25 min |
| Johnson County | 26,003 | $46K | $135K | 74% | 18% | 74% | 21 min |
| Lafayette County | 6,136 | $41K | $81K | 79% | 9% | 68% | 33 min |
| Lawrence County | 16,238 | $45K | $99K | 67% | 15% | 86% | 28 min |
| Lee County | 8,359 | $34K | $75K | 59% | 7% | 82% | 26 min |
| Lincoln County | 12,950 | $52K | $108K | 76% | 12% | 75% | 23 min |
| Little River County | 11,821 | $53K | $114K | 80% | 17% | 79% | 31 min |
| Logan County | 21,277 | $59K | $140K | 78% | 17% | 80% | 29 min |
| Lonoke County | 75,272 | $73K | $194K | 75% | 22% | 90% | 31 min |
| Madison County | 17,329 | $57K | $178K | 80% | 13% | 86% | 35 min |
| Marion County | 17,228 | $49K | $163K | 81% | 15% | 87% | 28 min |
| Miller County | 42,360 | $49K | $154K | 64% | 15% | 83% | 22 min |
| Mississippi County | 39,126 | $53K | $123K | 60% | 14% | 84% | 21 min |
| Monroe County | 6,589 | $43K | $89K | 63% | 13% | 82% | 31 min |
| Montgomery County | 8,553 | $49K | $152K | 81% | 17% | 78% | 33 min |
| Nevada County | 8,159 | $54K | $83K | 76% | 14% | 72% | 29 min |
| Newton County | 7,112 | $49K | $169K | 77% | 16% | 81% | 35 min |
| Ouachita County | 22,085 | $49K | $102K | 71% | 16% | 81% | 24 min |
| Perry County | 10,101 | $56K | $130K | 80% | 17% | 84% | 36 min |
| Phillips County | 15,450 | $40K | $78K | 51% | 15% | 79% | 21 min |
| Pike County | 10,115 | $49K | $122K | 75% | 19% | 83% | 31 min |
| Poinsett County | 22,543 | $47K | $103K | 64% | 11% | 81% | 26 min |
| Polk County | 19,361 | $49K | $138K | 79% | 18% | 80% | 22 min |
| Pope County | 64,131 | $57K | $170K | 70% | 25% | 85% | 22 min |
| Prairie County | 8,064 | $52K | $96K | 76% | 18% | 73% | 29 min |
| Pulaski County | 399,818 | $63K | $215K | 57% | 38% | 90% | 22 min |
| Randolph County | 18,838 | $51K | $131K | 74% | 12% | 79% | 25 min |
| Saline County | 127,479 | $79K | $221K | 78% | 29% | 89% | 27 min |
| Scott County | 9,816 | $43K | $115K | 78% | 13% | 78% | 28 min |
| Searcy County | 7,859 | $44K | $110K | 79% | 15% | 77% | 33 min |
| Sebastian County | 128,900 | $58K | $176K | 61% | 23% | 86% | 21 min |
| Sevier County | 15,712 | $54K | $118K | 68% | 9% | 78% | 27 min |
| Sharp County | 17,773 | $45K | $105K | 79% | 14% | 80% | 30 min |
| St. Francis County | 22,400 | $43K | $91K | 56% | 14% | 83% | 25 min |
| Stone County | 12,568 | $41K | $172K | 76% | 16% | 75% | 25 min |
| Union County | 37,900 | $55K | $121K | 73% | 19% | 85% | 21 min |
| Van Buren County | 15,998 | $50K | $136K | 78% | 15% | 82% | 35 min |
| Washington County | 256,765 | $71K | $298K | 56% | 35% | 91% | 23 min |
| White County | 77,838 | $55K | $164K | 69% | 20% | 87% | 24 min |
| Woodruff County | 6,026 | $48K | $107K | 65% | 16% | 71% | 24 min |
| Yell County | 20,134 | $56K | $144K | 68% | 15% | 80% | 23 min |
Source: U.S. Census Bureau, American Community Survey 2020–2024 5-year estimates
People.
3,049,391 residents in 1,205,987 households, next to the United States figure.
Source: U.S. Census Bureau, American Community Survey 2020–2024 5-year estimates
Homes.
1,394,673 housing units; the median owner-occupied home is valued at $188,000 (±$1,754).
When homes were built
Source: U.S. Census Bureau, American Community Survey 2020–2024 5-year estimates
Income and work.
Household income and work, in 2024 dollars; median household income ±$467.
The poverty rate uses the federal poverty thresholds, which vary with family size. It says nothing on its own about what a neighborhood is like to live in.
Source: U.S. Census Bureau, American Community Survey 2020–2024 5-year estimates
Getting around.
How workers aged 16 and over get to work, and how long it takes.
Source: U.S. Census Bureau, American Community Survey 2020–2024 5-year estimates
Internet.
Home internet subscriptions.
American Community Survey figures are estimates from a rolling sample, averaged over 2020–2024. Each comes with a margin of error, which is wider in places with fewer people.
Source: U.S. Census Bureau, American Community Survey 2020–2024 5-year estimates
Counties in Arkansas.
Every county has its own page, with all of its ZIP codes.