ZIP code 06605 is in Greater Bridgeport Planning Region, Connecticut. About 25,929 people live here in 10,380 households. The median home value is $335,500 and the median household income $56,179. The average commute takes about 33 minutes.
ZIP code tabulation area · ACS 2020–2024 · Updated October 24, 2026
$335,500median home valueGreater Bridgeport Planning Region: $429K
91%of households have broadbandhome internet subscription
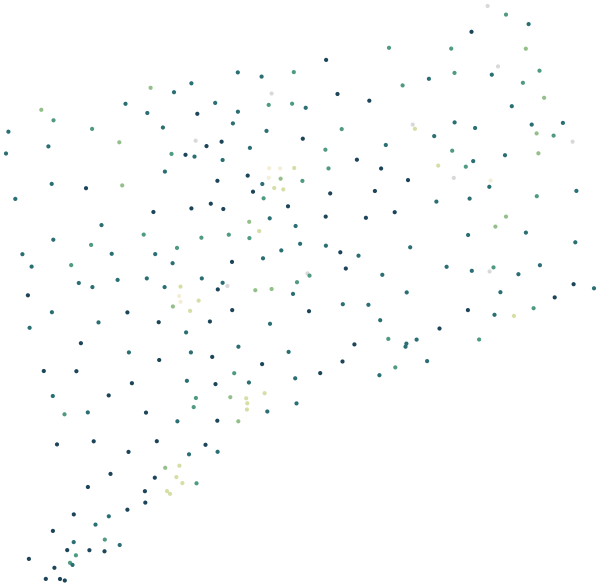
06605 in ConnecticutZIP codes coloured by median household income
06605
<$45K$125K+
Sources: U.S. Census Bureau, American Community Survey 2020–2024 5-year estimates · U.S. Census Bureau, 2024 Gazetteer and 2020 ZCTA relationship files
People.
25,929 residents in 10,380 households, next to the Greater Bridgeport Planning Region figure.
24%
under 18
HereGreater Bridgeport Planning Region
29%
aged 18–34
HereGreater Bridgeport Planning Region
12%
aged 65 and over
HereGreater Bridgeport Planning Region
41%
of households are people living alone
HereGreater Bridgeport Planning Region
23%
of households are married couples
HereGreater Bridgeport Planning Region
Source: U.S. Census Bureau, American Community Survey 2020–2024 5-year estimates
Homes.
10,928 housing units; the median owner-occupied home is valued at $335,500 (±$29,121).
32%
of households own their home
HereGreater Bridgeport Planning Region
20%
of homes are detached single-family houses
HereGreater Bridgeport Planning Region
32%
are in buildings with 5 or more units
HereGreater Bridgeport Planning Region
0%
are mobile homes
HereGreater Bridgeport Planning Region
5%
of housing units are vacant
HereGreater Bridgeport Planning Region
$1,477
median gross rent a month
HereGreater Bridgeport Planning Region
When homes were built
2020 or later2%
2010–20197%
2000–20092%
1990–19995%
1980–19897%
1970–197914%
1960–19698%
1950–19599%
1940–19497%
1939 or earlier39%
Source: U.S. Census Bureau, American Community Survey 2020–2024 5-year estimates
Income and work.
Household income and work, in 2024 dollars; median household income ±$7,523.
$56,179
median household income
HereGreater Bridgeport Planning Region
25.7%
of people live below the poverty line
HereGreater Bridgeport Planning Region
9.1%
unemployment rate
HereGreater Bridgeport Planning Region
32%
of adults 25+ hold a bachelor’s degree or higher
HereGreater Bridgeport Planning Region
The poverty rate uses the federal poverty thresholds, which vary with family size. It says nothing on its own about what a neighborhood is like to live in.
Source: U.S. Census Bureau, American Community Survey 2020–2024 5-year estimates
Getting around.
How workers aged 16 and over get to work, and how long it takes.
33 min
average commute to work
HereGreater Bridgeport Planning Region
25%
of commuters travel 45 minutes or more
HereGreater Bridgeport Planning Region
75%
of workers drive or carpool
HereGreater Bridgeport Planning Region
6%
take public transportation
HereGreater Bridgeport Planning Region
5%
walk or bike
HereGreater Bridgeport Planning Region
11%
work from home
HereGreater Bridgeport Planning Region
18%
of households have no car
HereGreater Bridgeport Planning Region
Source: U.S. Census Bureau, American Community Survey 2020–2024 5-year estimates
Internet.
Home internet subscriptions.
91%
of households have a broadband subscription
HereGreater Bridgeport Planning Region
7%
have no internet access at home
HereGreater Bridgeport Planning Region
American Community Survey figures are estimates from a rolling sample, averaged over 2020–2024. Each comes with a margin of error, which is wider in places with fewer people.
Source: U.S. Census Bureau, American Community Survey 2020–2024 5-year estimates
Businesses in 06605.
348 business establishments with paid employees have an address in this ZIP code.
Grocery stores and supermarkets5
Convenience stores6
Pharmacies and drug stores4
Retail bakeries0
Full-service restaurants13
Limited-service restaurants14
Coffee shops and snack bars4
Bars3
Physicians’ offices5
Dentists’ offices0
Child care centers4
Gyms and fitness centers0
Movie theaters0
Museums0
Counts are business establishments with paid employees, by the ZIP code of their address. Self-employed people without staff, and public facilities such as libraries, are not included.
Source: U.S. Census Bureau, ZIP Code Business Patterns 2023
Health.
Estimated share of adults in 06605, next to the national figure.
76%
had a routine checkup in the past year
HereUnited States
59%
visited a dentist in the past year
HereUnited States
21%
of 18–64s have no health insurance
HereUnited States
34%
get no leisure-time physical activity
HereUnited States
41%
usually sleep less than 7 hours
HereUnited States
14%
smoke
HereUnited States
33%
have obesity
HereUnited States
12%
have diagnosed diabetes
HereUnited States
32%
have high blood pressure
HereUnited States
24%
report fair or poor general health
HereUnited States
18%
report frequent mental distress
HereUnited States
38%
often feel lonely
HereUnited States
31%
faced food insecurity in the past year
HereUnited States
25%
faced housing insecurity in the past year
HereUnited States
16%
lacked reliable transportation in the past year
HereUnited States
These are model-based estimates for adults from the CDC’s PLACES project, combining national health surveys with local population data. They are not counts of local patients, and small differences between nearby ZIP codes are within the margin of the model.
Source: Centers for Disease Control and Prevention, PLACES 2025 release (ZCTA), public domain
Nearest public schools.
In a straight line from the center of the ZIP code. Attendance zones are set by each school district.
Geraldine Claytor Magnet AcademyBridgeport0.1 mi
Black Rock SchoolBridgeport0.6 mi
Great Oaks Charter SchoolBridgeport0.6 mi
Park City Prep Charter SchoolBridgeport0.6 mi
Cesar Batalla SchoolBridgeport0.8 mi
Source: National Center for Education Statistics, EDGE public school locations 2024–25
Nearby ZIP codes.
ZIP codes here are the Census Bureau’s ZIP Code Tabulation Areas, which closely match the postal ZIP codes used for addresses.
 06605