Naugatuck Valley Planning Region
Naugatuck Valley Planning Region has 454,969 residents across 39 ZIP codes with their own report. Median household income is $86,191, 10% below the Connecticut figure. The typical owner-occupied home is valued at $317,700, and 34% of adults 25 and over hold a bachelor’s degree or higher.

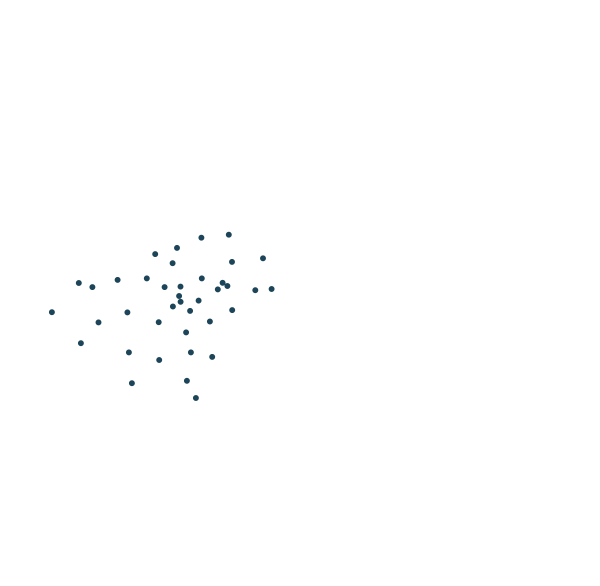
Sources: U.S. Census Bureau, American Community Survey 2020–2024 5-year estimates · U.S. Census Bureau, 2024 Gazetteer and 2020 ZCTA relationship files
All 39 ZIP codes.
Colour shows where each zip code sits among the others in the table, from lowest to highest.
| ZIP code | Residents | Household income | Home value | Owners | Bachelor's+ | Broadband | Commute |
|---|---|---|---|---|---|---|---|
| 06010 | 61,684 | $79K | $278K | 65% | 30% | 92% | 26 min |
| 06037 | 19,173 | $116K | $377K | 83% | 45% | 94% | 23 min |
| 06062 | 17,555 | $84K | $254K | 68% | 30% | 87% | 23 min |
| 06401 | 19,315 | $86K | $286K | 58% | 22% | 92% | 27 min |
| 06403 | 6,147 | $102K | $350K | 86% | 45% | 94% | 33 min |
| 06410 | 28,904 | $145K | $439K | 87% | 61% | 92% | 30 min |
| 06444 | 180 | $140K | $288K | 75% | 48% | 75% | 11 min |
| 06450 | 35,694 | $71K | $243K | 62% | 24% | 92% | 24 min |
| 06451 | 24,851 | $71K | $240K | 57% | 20% | 87% | 26 min |
| 06467 | 405 | $-666667K | $-666667K | 42% | 53% | 100% | 29 min |
| 06478 | 12,991 | $129K | $472K | 90% | 46% | 98% | 32 min |
| 06479 | 10,286 | $114K | $359K | 81% | 39% | 91% | 26 min |
| 06482 | 12,000 | $160K | $499K | 93% | 61% | 98% | 38 min |
| 06483 | 16,889 | $108K | $370K | 74% | 33% | 92% | 33 min |
| 06488 | 20,071 | $113K | $412K | 88% | 52% | 93% | 32 min |
| 06489 | 32,706 | $126K | $380K | 82% | 45% | 94% | 26 min |
| 06524 | 5,288 | $166K | $418K | 97% | 58% | 96% | 35 min |
| 06702 | 2,946 | $14K | $286K | 8% | 10% | 66% | 28 min |
| 06704 | 31,713 | $49K | $192K | 45% | 14% | 89% | 31 min |
| 06705 | 25,266 | $54K | $202K | 51% | 19% | 81% | 28 min |
| 06706 | 15,551 | $52K | $211K | 41% | 17% | 89% | 28 min |
| 06708 | 29,594 | $67K | $219K | 59% | 22% | 90% | 30 min |
| 06710 | 9,942 | $37K | $228K | 34% | 13% | 79% | 28 min |
| 06712 | 9,458 | $126K | $355K | 94% | 40% | 96% | 30 min |
| 06716 | 16,113 | $111K | $325K | 88% | 37% | 91% | 32 min |
| 06751 | 3,423 | $109K | $411K | 70% | 39% | 86% | 32 min |
| 06752 | 1,658 | $159K | $693K | 92% | 59% | 96% | 31 min |
| 06762 | 7,807 | $133K | $476K | 88% | 53% | 96% | 28 min |
| 06770 | 31,823 | $96K | $259K | 68% | 32% | 92% | 34 min |
| 06776 | 27,010 | $104K | $387K | 80% | 41% | 96% | 32 min |
| 06779 | 8,364 | $96K | $277K | 76% | 31% | 91% | 26 min |
| 06782 | 1,978 | $125K | $327K | 91% | 29% | 95% | 26 min |
| 06783 | 2,185 | $124K | $715K | 83% | 65% | 92% | 36 min |
| 06786 | 9,768 | $87K | $265K | 74% | 29% | 90% | 32 min |
| 06787 | 7,509 | $103K | $283K | 78% | 34% | 90% | 29 min |
| 06793 | 1,031 | $121K | $1.03M | 81% | 60% | 88% | 27 min |
| 06794 | 1,282 | $97K | $733K | 74% | 47% | 97% | 23 min |
| 06795 | 13,889 | $105K | $366K | 90% | 43% | 95% | 26 min |
| 06798 | 9,833 | $131K | $470K | 78% | 50% | 98% | 35 min |
Source: U.S. Census Bureau, American Community Survey 2020–2024 5-year estimates
People.
454,969 residents in 180,116 households, next to the Connecticut figure.
Source: U.S. Census Bureau, American Community Survey 2020–2024 5-year estimates
Homes.
192,551 housing units; the median owner-occupied home is valued at $317,700 (±$5,035).
When homes were built
Source: U.S. Census Bureau, American Community Survey 2020–2024 5-year estimates
Income and work.
Household income and work, in 2024 dollars; median household income ±$1,654.
The poverty rate uses the federal poverty thresholds, which vary with family size. It says nothing on its own about what a neighborhood is like to live in.
Source: U.S. Census Bureau, American Community Survey 2020–2024 5-year estimates
Getting around.
How workers aged 16 and over get to work, and how long it takes.
Source: U.S. Census Bureau, American Community Survey 2020–2024 5-year estimates
Internet.
Home internet subscriptions.
American Community Survey figures are estimates from a rolling sample, averaged over 2020–2024. Each comes with a margin of error, which is wider in places with fewer people.
Source: U.S. Census Bureau, American Community Survey 2020–2024 5-year estimates