Illinois
Illinois has 12,694,798 residents in 102 counties and 1,342 ZIP codes. The median household income is $83,390, 3% above the national figure, and the typical owner-occupied home is valued at $263,300. 67% of households own their home.
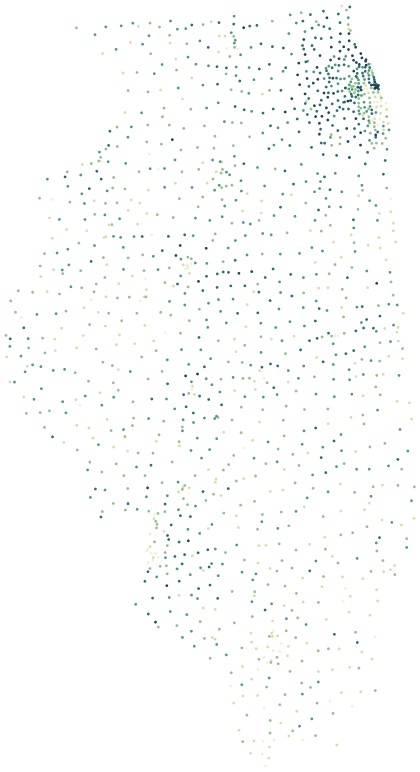
Sources: U.S. Census Bureau, American Community Survey 2020–2024 5-year estimates · U.S. Census Bureau, 2024 Gazetteer and 2020 ZCTA relationship files
All 102 counties.
Colour shows where each county sits among the others in the table, from lowest to highest.
| County | Residents | Household income | Home value | Owners | Bachelor's+ | Broadband | Commute |
|---|---|---|---|---|---|---|---|
| Adams County | 64,754 | $66K | $163K | 72% | 28% | 87% | 18 min |
| Alexander County | 4,875 | $47K | $60K | 78% | 13% | 62% | 30 min |
| Bond County | 16,716 | $66K | $146K | 77% | 22% | 87% | 25 min |
| Boone County | 53,230 | $85K | $217K | 82% | 24% | 91% | 28 min |
| Brown County | 6,322 | $68K | $150K | 72% | 13% | 85% | 18 min |
| Bureau County | 32,866 | $69K | $127K | 76% | 22% | 86% | 23 min |
| Calhoun County | 4,330 | $93K | $191K | 89% | 20% | 86% | 48 min |
| Carroll County | 15,576 | $61K | $115K | 77% | 18% | 86% | 26 min |
| Cass County | 12,784 | $68K | $97K | 76% | 21% | 87% | 22 min |
| Champaign County | 208,741 | $64K | $212K | 54% | 46% | 91% | 19 min |
| Christian County | 33,538 | $63K | $116K | 75% | 17% | 88% | 24 min |
| Clark County | 15,266 | $73K | $132K | 80% | 25% | 88% | 27 min |
| Clay County | 13,052 | $60K | $97K | 79% | 13% | 86% | 24 min |
| Clinton County | 36,954 | $87K | $192K | 80% | 26% | 91% | 28 min |
| Coles County | 46,777 | $56K | $127K | 60% | 27% | 86% | 20 min |
| Cook County | 5,182,090 | $83K | $325K | 58% | 43% | 91% | 34 min |
| Crawford County | 18,511 | $72K | $121K | 82% | 21% | 89% | 19 min |
| Cumberland County | 10,334 | $73K | $126K | 84% | 20% | 87% | 24 min |
| De Witt County | 15,373 | $72K | $130K | 79% | 23% | 86% | 25 min |
| DeKalb County | 100,703 | $71K | $244K | 61% | 33% | 93% | 28 min |
| Douglas County | 19,751 | $77K | $150K | 77% | 21% | 83% | 22 min |
| DuPage County | 930,024 | $112K | $391K | 73% | 52% | 95% | 30 min |
| Edgar County | 16,535 | $60K | $97K | 73% | 20% | 87% | 19 min |
| Edwards County | 6,075 | $61K | $100K | 79% | 14% | 85% | 25 min |
| Effingham County | 34,522 | $80K | $190K | 78% | 27% | 91% | 19 min |
| Fayette County | 21,315 | $61K | $131K | 81% | 17% | 84% | 27 min |
| Ford County | 13,406 | $62K | $122K | 72% | 19% | 87% | 26 min |
| Franklin County | 37,323 | $57K | $89K | 74% | 16% | 83% | 28 min |
| Fulton County | 33,020 | $61K | $107K | 77% | 19% | 88% | 27 min |
| Gallatin County | 4,819 | $59K | $83K | 77% | 14% | 82% | 28 min |
| Greene County | 11,683 | $62K | $95K | 78% | 19% | 88% | 32 min |
| Grundy County | 53,219 | $92K | $272K | 74% | 24% | 92% | 29 min |
| Hamilton County | 7,916 | $66K | $114K | 76% | 21% | 81% | 29 min |
| Hancock County | 17,281 | $66K | $114K | 81% | 25% | 82% | 26 min |
| Hardin County | 3,605 | $54K | $104K | 80% | 13% | 79% | 32 min |
| Henderson County | 6,193 | $62K | $104K | 81% | 21% | 84% | 28 min |
| Henry County | 48,643 | $72K | $152K | 80% | 25% | 87% | 24 min |
| Iroquois County | 26,449 | $66K | $138K | 80% | 18% | 87% | 27 min |
| Jackson County | 53,064 | $49K | $137K | 50% | 36% | 87% | 22 min |
| Jasper County | 9,180 | $75K | $126K | 85% | 21% | 88% | 29 min |
| Jefferson County | 36,550 | $63K | $126K | 72% | 18% | 86% | 21 min |
| Jersey County | 21,274 | $80K | $172K | 81% | 23% | 86% | 30 min |
| Jo Daviess County | 21,851 | $74K | $210K | 80% | 29% | 87% | 23 min |
| Johnson County | 13,376 | $63K | $161K | 82% | 20% | 80% | 29 min |
| Kane County | 517,255 | $103K | $327K | 76% | 38% | 93% | 30 min |
| Kankakee County | 106,635 | $71K | $193K | 70% | 21% | 89% | 27 min |
| Kendall County | 137,675 | $112K | $322K | 84% | 37% | 96% | 34 min |
| Knox County | 49,046 | $57K | $112K | 71% | 21% | 84% | 21 min |
| LaSalle County | 108,714 | $73K | $162K | 74% | 21% | 87% | 27 min |
| Lake County | 714,223 | $110K | $346K | 75% | 48% | 94% | 31 min |
| Lawrence County | 15,031 | $55K | $99K | 72% | 15% | 90% | 23 min |
| Lee County | 33,869 | $70K | $155K | 74% | 19% | 87% | 26 min |
| Livingston County | 35,565 | $74K | $142K | 74% | 19% | 89% | 23 min |
| Logan County | 27,713 | $66K | $134K | 69% | 21% | 90% | 22 min |
| Macon County | 101,849 | $63K | $127K | 70% | 24% | 89% | 21 min |
| Macoupin County | 44,350 | $71K | $138K | 79% | 20% | 89% | 29 min |
| Madison County | 264,238 | $76K | $173K | 74% | 31% | 91% | 27 min |
| Marion County | 37,000 | $61K | $103K | 75% | 17% | 86% | 22 min |
| Marshall County | 11,647 | $72K | $143K | 79% | 18% | 86% | 29 min |
| Mason County | 12,745 | $63K | $103K | 82% | 17% | 87% | 32 min |
| Massac County | 13,865 | $65K | $122K | 76% | 17% | 78% | 22 min |
| McDonough County | 26,920 | $53K | $108K | 64% | 31% | 84% | 20 min |
| McHenry County | 312,591 | $105K | $308K | 83% | 35% | 95% | 33 min |
| McLean County | 171,556 | $80K | $208K | 65% | 47% | 90% | 20 min |
| Menard County | 12,095 | $82K | $186K | 80% | 28% | 90% | 28 min |
| Mercer County | 15,495 | $74K | $147K | 84% | 21% | 91% | 29 min |
| Monroe County | 35,036 | $103K | $282K | 85% | 39% | 93% | 30 min |
| Montgomery County | 27,942 | $64K | $112K | 77% | 18% | 85% | 25 min |
| Morgan County | 33,021 | $66K | $131K | 73% | 23% | 85% | 20 min |
| Moultrie County | 14,424 | $72K | $134K | 76% | 19% | 83% | 23 min |
| Ogle County | 51,495 | $82K | $189K | 75% | 24% | 88% | 27 min |
| Peoria County | 179,645 | $65K | $159K | 67% | 35% | 90% | 21 min |
| Perry County | 20,639 | $62K | $113K | 81% | 14% | 87% | 26 min |
| Piatt County | 16,695 | $95K | $181K | 85% | 33% | 91% | 25 min |
| Pike County | 14,469 | $60K | $101K | 78% | 19% | 83% | 25 min |
| Pope County | 3,739 | $60K | $144K | 86% | 16% | 75% | 31 min |
| Pulaski County | 5,015 | $42K | $85K | 68% | 13% | 61% | 32 min |
| Putnam County | 5,601 | $76K | $173K | 82% | 23% | 87% | 30 min |
| Randolph County | 30,058 | $68K | $135K | 77% | 15% | 87% | 25 min |
| Richland County | 15,598 | $62K | $112K | 74% | 19% | 87% | 21 min |
| Rock Island County | 142,757 | $67K | $150K | 70% | 25% | 91% | 21 min |
| Saline County | 23,213 | $53K | $94K | 73% | 20% | 77% | 25 min |
| Sangamon County | 194,947 | $75K | $176K | 71% | 37% | 91% | 21 min |
| Schuyler County | 6,787 | $66K | $110K | 79% | 19% | 88% | 21 min |
| Scott County | 4,937 | $67K | $96K | 79% | 22% | 83% | 26 min |
| Shelby County | 20,720 | $72K | $137K | 78% | 18% | 89% | 22 min |
| St. Clair County | 253,694 | $74K | $180K | 68% | 32% | 90% | 26 min |
| Stark County | 5,308 | $63K | $105K | 80% | 21% | 85% | 28 min |
| Stephenson County | 43,768 | $64K | $135K | 71% | 21% | 87% | 22 min |
| Tazewell County | 130,290 | $78K | $168K | 78% | 28% | 90% | 22 min |
| Union County | 16,997 | $56K | $132K | 77% | 21% | 73% | 26 min |
| Vermilion County | 72,386 | $57K | $97K | 70% | 19% | 88% | 22 min |
| Wabash County | 11,119 | $57K | $105K | 76% | 19% | 85% | 25 min |
| Warren County | 16,447 | $67K | $105K | 75% | 22% | 85% | 20 min |
| Washington County | 13,627 | $78K | $156K | 84% | 24% | 87% | 28 min |
| Wayne County | 15,973 | $56K | $111K | 78% | 16% | 83% | 26 min |
| White County | 13,619 | $55K | $108K | 77% | 18% | 79% | 27 min |
| Whiteside County | 54,947 | $68K | $127K | 77% | 21% | 87% | 22 min |
| Will County | 701,462 | $110K | $320K | 83% | 38% | 94% | 34 min |
| Williamson County | 66,876 | $66K | $156K | 71% | 26% | 88% | 25 min |
| Winnebago County | 283,292 | $66K | $165K | 66% | 25% | 89% | 25 min |
| Woodford County | 38,312 | $91K | $198K | 86% | 36% | 88% | 26 min |
Source: U.S. Census Bureau, American Community Survey 2020–2024 5-year estimates
People.
12,694,798 residents in 5,036,449 households, next to the United States figure.
Source: U.S. Census Bureau, American Community Survey 2020–2024 5-year estimates
Homes.
5,457,452 housing units; the median owner-occupied home is valued at $263,300 (±$797).
When homes were built
Source: U.S. Census Bureau, American Community Survey 2020–2024 5-year estimates
Income and work.
Household income and work, in 2024 dollars; median household income ±$362.
The poverty rate uses the federal poverty thresholds, which vary with family size. It says nothing on its own about what a neighborhood is like to live in.
Source: U.S. Census Bureau, American Community Survey 2020–2024 5-year estimates
Getting around.
How workers aged 16 and over get to work, and how long it takes.
Source: U.S. Census Bureau, American Community Survey 2020–2024 5-year estimates
Internet.
Home internet subscriptions.
American Community Survey figures are estimates from a rolling sample, averaged over 2020–2024. Each comes with a margin of error, which is wider in places with fewer people.
Source: U.S. Census Bureau, American Community Survey 2020–2024 5-year estimates
Counties in Illinois.
Every county has its own page, with all of its ZIP codes.