Indiana
Indiana has 6,851,073 residents in 92 counties and 745 ZIP codes. The median household income is $71,957, 11% below the national figure, and the typical owner-occupied home is valued at $218,200. 71% of households own their home.
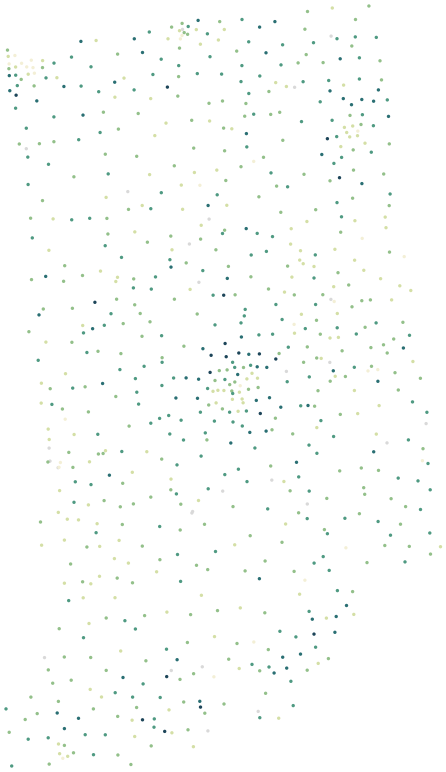
Sources: U.S. Census Bureau, American Community Survey 2020–2024 5-year estimates · U.S. Census Bureau, 2024 Gazetteer and 2020 ZCTA relationship files
All 92 counties.
Colour shows where each county sits among the others in the table, from lowest to highest.
| County | Residents | Household income | Home value | Owners | Bachelor's+ | Broadband | Commute |
|---|---|---|---|---|---|---|---|
| Adams County | 36,227 | $65K | $178K | 84% | 16% | 78% | 25 min |
| Allen County | 392,378 | $71K | $215K | 69% | 32% | 91% | 23 min |
| Bartholomew County | 83,536 | $80K | $233K | 69% | 34% | 93% | 23 min |
| Benton County | 8,735 | $66K | $151K | 80% | 20% | 89% | 27 min |
| Blackford County | 11,950 | $51K | $108K | 74% | 15% | 85% | 29 min |
| Boone County | 74,718 | $111K | $376K | 79% | 52% | 94% | 25 min |
| Brown County | 15,606 | $79K | $269K | 87% | 26% | 88% | 39 min |
| Carroll County | 20,535 | $66K | $181K | 82% | 17% | 84% | 27 min |
| Cass County | 37,680 | $56K | $134K | 74% | 17% | 84% | 24 min |
| Clark County | 124,354 | $74K | $223K | 75% | 28% | 91% | 24 min |
| Clay County | 26,409 | $70K | $153K | 81% | 20% | 88% | 30 min |
| Clinton County | 32,944 | $65K | $164K | 74% | 17% | 88% | 24 min |
| Crawford County | 10,499 | $50K | $118K | 81% | 11% | 74% | 40 min |
| Daviess County | 33,658 | $69K | $197K | 72% | 17% | 82% | 23 min |
| DeKalb County | 43,807 | $74K | $194K | 82% | 20% | 88% | 23 min |
| Dearborn County | 51,094 | $85K | $243K | 85% | 25% | 89% | 32 min |
| Decatur County | 26,422 | $70K | $199K | 76% | 20% | 88% | 25 min |
| Delaware County | 112,280 | $58K | $139K | 67% | 26% | 88% | 23 min |
| Dubois County | 43,614 | $76K | $230K | 75% | 26% | 86% | 22 min |
| Elkhart County | 207,132 | $69K | $210K | 72% | 20% | 89% | 21 min |
| Fayette County | 23,334 | $59K | $131K | 72% | 16% | 87% | 29 min |
| Floyd County | 80,918 | $80K | $251K | 73% | 33% | 90% | 25 min |
| Fountain County | 16,617 | $63K | $143K | 75% | 15% | 90% | 27 min |
| Franklin County | 23,020 | $78K | $250K | 82% | 20% | 83% | 38 min |
| Fulton County | 20,312 | $61K | $157K | 80% | 17% | 88% | 26 min |
| Gibson County | 33,000 | $68K | $180K | 77% | 19% | 89% | 22 min |
| Grant County | 66,295 | $54K | $122K | 73% | 20% | 88% | 23 min |
| Greene County | 31,021 | $62K | $153K | 77% | 16% | 83% | 31 min |
| Hamilton County | 365,056 | $122K | $406K | 76% | 62% | 96% | 28 min |
| Hancock County | 84,037 | $93K | $275K | 80% | 35% | 94% | 30 min |
| Harrison County | 39,859 | $74K | $230K | 84% | 22% | 85% | 33 min |
| Hendricks County | 183,344 | $101K | $308K | 78% | 40% | 94% | 27 min |
| Henry County | 48,970 | $63K | $154K | 76% | 18% | 89% | 28 min |
| Howard County | 83,752 | $64K | $165K | 71% | 21% | 89% | 22 min |
| Huntington County | 36,798 | $66K | $162K | 77% | 21% | 87% | 24 min |
| Jackson County | 46,660 | $70K | $178K | 73% | 20% | 86% | 24 min |
| Jasper County | 33,234 | $77K | $222K | 84% | 19% | 91% | 32 min |
| Jay County | 20,229 | $55K | $118K | 80% | 13% | 83% | 24 min |
| Jefferson County | 32,998 | $65K | $195K | 72% | 20% | 87% | 25 min |
| Jennings County | 27,562 | $69K | $162K | 79% | 15% | 88% | 28 min |
| Johnson County | 166,315 | $90K | $285K | 73% | 35% | 93% | 28 min |
| Knox County | 36,007 | $61K | $138K | 68% | 19% | 88% | 21 min |
| Kosciusko County | 80,442 | $75K | $216K | 77% | 25% | 87% | 22 min |
| LaGrange County | 40,805 | $84K | $256K | 83% | 12% | 67% | 24 min |
| LaPorte County | 111,917 | $71K | $196K | 75% | 23% | 90% | 26 min |
| Lake County | 500,379 | $71K | $231K | 72% | 26% | 90% | 31 min |
| Lawrence County | 45,102 | $66K | $175K | 81% | 20% | 84% | 29 min |
| Madison County | 131,900 | $63K | $161K | 70% | 21% | 90% | 28 min |
| Marion County | 975,809 | $66K | $224K | 57% | 35% | 92% | 26 min |
| Marshall County | 46,284 | $72K | $205K | 76% | 21% | 84% | 24 min |
| Martin County | 9,830 | $69K | $159K | 79% | 13% | 86% | 31 min |
| Miami County | 35,712 | $61K | $126K | 76% | 16% | 88% | 26 min |
| Monroe County | 140,965 | $66K | $285K | 54% | 50% | 90% | 21 min |
| Montgomery County | 38,312 | $71K | $172K | 80% | 20% | 90% | 25 min |
| Morgan County | 72,659 | $79K | $238K | 82% | 21% | 90% | 33 min |
| Newton County | 13,922 | $75K | $172K | 81% | 15% | 87% | 34 min |
| Noble County | 47,495 | $72K | $197K | 77% | 19% | 86% | 27 min |
| Ohio County | 5,999 | $70K | $213K | 81% | 18% | 86% | 37 min |
| Orange County | 19,767 | $66K | $159K | 79% | 16% | 85% | 27 min |
| Owen County | 21,604 | $62K | $172K | 81% | 17% | 81% | 36 min |
| Parke County | 16,406 | $68K | $151K | 82% | 15% | 79% | 32 min |
| Perry County | 19,270 | $61K | $163K | 76% | 17% | 84% | 26 min |
| Pike County | 12,154 | $71K | $155K | 87% | 16% | 84% | 29 min |
| Porter County | 174,818 | $88K | $282K | 78% | 31% | 93% | 30 min |
| Posey County | 25,116 | $78K | $223K | 82% | 25% | 90% | 25 min |
| Pulaski County | 12,441 | $63K | $156K | 75% | 14% | 91% | 28 min |
| Putnam County | 37,280 | $78K | $219K | 75% | 20% | 89% | 31 min |
| Randolph County | 24,387 | $61K | $113K | 77% | 15% | 86% | 26 min |
| Ripley County | 29,095 | $71K | $223K | 77% | 21% | 88% | 28 min |
| Rush County | 16,739 | $66K | $167K | 75% | 19% | 86% | 29 min |
| Scott County | 24,526 | $56K | $158K | 71% | 13% | 90% | 26 min |
| Shelby County | 45,265 | $72K | $212K | 73% | 22% | 89% | 26 min |
| Spencer County | 19,955 | $75K | $185K | 81% | 22% | 84% | 28 min |
| St. Joseph County | 273,040 | $67K | $193K | 69% | 34% | 90% | 23 min |
| Starke County | 23,365 | $64K | $158K | 83% | 13% | 85% | 31 min |
| Steuben County | 34,726 | $75K | $216K | 80% | 26% | 87% | 23 min |
| Sullivan County | 20,780 | $56K | $131K | 76% | 15% | 83% | 27 min |
| Switzerland County | 9,909 | $65K | $176K | 79% | 9% | 81% | 35 min |
| Tippecanoe County | 189,071 | $61K | $239K | 53% | 41% | 91% | 20 min |
| Tipton County | 15,346 | $76K | $175K | 81% | 24% | 90% | 30 min |
| Union County | 6,985 | $76K | $174K | 80% | 18% | 90% | 28 min |
| Vanderburgh County | 180,117 | $62K | $184K | 65% | 28% | 91% | 21 min |
| Vermillion County | 15,421 | $60K | $113K | 75% | 18% | 87% | 29 min |
| Vigo County | 106,109 | $53K | $149K | 62% | 26% | 86% | 22 min |
| Wabash County | 30,844 | $67K | $157K | 81% | 23% | 89% | 23 min |
| Warren County | 8,464 | $82K | $183K | 82% | 18% | 90% | 28 min |
| Warrick County | 65,261 | $90K | $243K | 82% | 35% | 92% | 25 min |
| Washington County | 28,212 | $65K | $172K | 82% | 15% | 85% | 33 min |
| Wayne County | 66,397 | $56K | $140K | 69% | 21% | 88% | 23 min |
| Wells County | 28,420 | $72K | $198K | 76% | 20% | 85% | 25 min |
| White County | 24,717 | $67K | $176K | 81% | 19% | 89% | 25 min |
| Whitley County | 34,618 | $78K | $219K | 82% | 24% | 90% | 24 min |
Source: U.S. Census Bureau, American Community Survey 2020–2024 5-year estimates
People.
6,851,073 residents in 2,716,009 households, next to the United States figure.
Source: U.S. Census Bureau, American Community Survey 2020–2024 5-year estimates
Homes.
2,976,568 housing units; the median owner-occupied home is valued at $218,200 (±$739).
When homes were built
Source: U.S. Census Bureau, American Community Survey 2020–2024 5-year estimates
Income and work.
Household income and work, in 2024 dollars; median household income ±$352.
The poverty rate uses the federal poverty thresholds, which vary with family size. It says nothing on its own about what a neighborhood is like to live in.
Source: U.S. Census Bureau, American Community Survey 2020–2024 5-year estimates
Getting around.
How workers aged 16 and over get to work, and how long it takes.
Source: U.S. Census Bureau, American Community Survey 2020–2024 5-year estimates
Internet.
Home internet subscriptions.
American Community Survey figures are estimates from a rolling sample, averaged over 2020–2024. Each comes with a margin of error, which is wider in places with fewer people.
Source: U.S. Census Bureau, American Community Survey 2020–2024 5-year estimates
Counties in Indiana.
Every county has its own page, with all of its ZIP codes.