Iowa
Iowa has 3,210,507 residents in 99 counties and 911 ZIP codes. The median household income is $75,059, 7% below the national figure, and the typical owner-occupied home is valued at $208,000. 72% of households own their home.
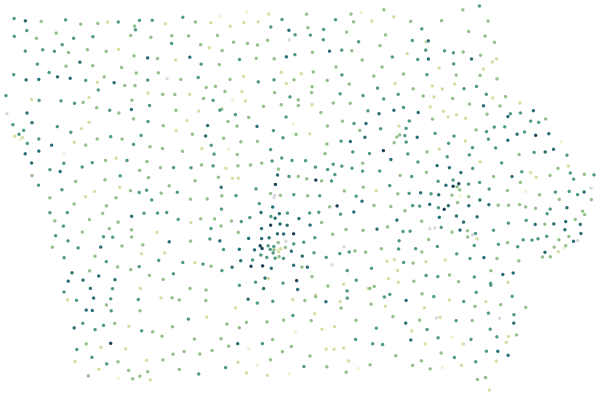
Sources: U.S. Census Bureau, American Community Survey 2020–2024 5-year estimates · U.S. Census Bureau, 2024 Gazetteer and 2020 ZCTA relationship files
All 99 counties.
Colour shows where each county sits among the others in the table, from lowest to highest.
| County | Residents | Household income | Home value | Owners | Bachelor's+ | Broadband | Commute |
|---|---|---|---|---|---|---|---|
| Adair County | 7,460 | $68K | $160K | 74% | 20% | 84% | 23 min |
| Adams County | 3,622 | $72K | $132K | 77% | 27% | 85% | 21 min |
| Allamakee County | 14,092 | $71K | $172K | 80% | 22% | 86% | 24 min |
| Appanoose County | 12,184 | $55K | $124K | 69% | 21% | 84% | 23 min |
| Audubon County | 5,599 | $58K | $122K | 76% | 21% | 84% | 21 min |
| Benton County | 25,724 | $87K | $208K | 85% | 26% | 89% | 27 min |
| Black Hawk County | 131,049 | $66K | $189K | 66% | 30% | 89% | 17 min |
| Boone County | 26,668 | $84K | $212K | 80% | 29% | 89% | 24 min |
| Bremer County | 25,204 | $87K | $220K | 80% | 36% | 93% | 22 min |
| Buchanan County | 20,694 | $78K | $176K | 82% | 22% | 87% | 25 min |
| Buena Vista County | 20,753 | $72K | $160K | 73% | 22% | 92% | 15 min |
| Butler County | 14,268 | $74K | $165K | 84% | 21% | 87% | 26 min |
| Calhoun County | 9,803 | $65K | $119K | 81% | 22% | 87% | 23 min |
| Carroll County | 20,594 | $73K | $176K | 77% | 24% | 87% | 17 min |
| Cass County | 13,096 | $63K | $150K | 72% | 22% | 84% | 17 min |
| Cedar County | 18,349 | $81K | $211K | 82% | 24% | 89% | 28 min |
| Cerro Gordo County | 42,632 | $68K | $166K | 70% | 24% | 89% | 17 min |
| Cherokee County | 11,600 | $71K | $159K | 76% | 23% | 87% | 18 min |
| Chickasaw County | 11,807 | $76K | $183K | 81% | 21% | 87% | 21 min |
| Clarke County | 9,662 | $72K | $161K | 72% | 16% | 87% | 27 min |
| Clay County | 16,461 | $65K | $179K | 73% | 28% | 90% | 19 min |
| Clayton County | 17,013 | $67K | $169K | 78% | 15% | 84% | 24 min |
| Clinton County | 46,268 | $67K | $161K | 75% | 22% | 87% | 23 min |
| Crawford County | 16,277 | $67K | $154K | 76% | 18% | 87% | 18 min |
| Dallas County | 107,968 | $102K | $356K | 69% | 52% | 92% | 23 min |
| Davis County | 9,157 | $77K | $162K | 83% | 17% | 73% | 27 min |
| Decatur County | 7,759 | $59K | $114K | 70% | 24% | 84% | 23 min |
| Delaware County | 17,558 | $75K | $178K | 80% | 23% | 86% | 22 min |
| Des Moines County | 38,487 | $63K | $137K | 75% | 24% | 87% | 19 min |
| Dickinson County | 17,990 | $75K | $271K | 78% | 31% | 91% | 18 min |
| Dubuque County | 99,030 | $78K | $237K | 73% | 33% | 90% | 18 min |
| Emmet County | 9,262 | $64K | $114K | 79% | 17% | 87% | 21 min |
| Fayette County | 19,288 | $60K | $137K | 77% | 21% | 85% | 24 min |
| Floyd County | 15,328 | $69K | $144K | 77% | 18% | 83% | 20 min |
| Franklin County | 9,956 | $60K | $124K | 72% | 19% | 84% | 21 min |
| Fremont County | 6,514 | $72K | $154K | 78% | 21% | 88% | 24 min |
| Greene County | 8,688 | $63K | $155K | 76% | 21% | 90% | 24 min |
| Grundy County | 12,384 | $87K | $199K | 85% | 28% | 89% | 25 min |
| Guthrie County | 10,688 | $78K | $180K | 84% | 25% | 89% | 29 min |
| Hamilton County | 14,886 | $72K | $156K | 73% | 23% | 85% | 23 min |
| Hancock County | 10,671 | $71K | $141K | 83% | 21% | 88% | 21 min |
| Hardin County | 16,639 | $65K | $123K | 74% | 22% | 85% | 22 min |
| Harrison County | 14,632 | $80K | $176K | 77% | 22% | 86% | 29 min |
| Henry County | 20,004 | $67K | $164K | 74% | 23% | 88% | 21 min |
| Howard County | 9,445 | $67K | $148K | 77% | 20% | 86% | 25 min |
| Humboldt County | 9,591 | $72K | $156K | 77% | 19% | 87% | 20 min |
| Ida County | 6,911 | $63K | $109K | 73% | 22% | 86% | 18 min |
| Iowa County | 16,507 | $71K | $194K | 77% | 25% | 89% | 24 min |
| Jackson County | 19,390 | $74K | $175K | 81% | 20% | 86% | 26 min |
| Jasper County | 37,954 | $71K | $186K | 72% | 20% | 90% | 25 min |
| Jefferson County | 15,705 | $62K | $163K | 68% | 43% | 88% | 18 min |
| Johnson County | 156,639 | $75K | $309K | 59% | 55% | 89% | 21 min |
| Jones County | 20,896 | $74K | $185K | 81% | 22% | 87% | 27 min |
| Keokuk County | 9,924 | $62K | $119K | 81% | 17% | 84% | 29 min |
| Kossuth County | 14,516 | $68K | $148K | 79% | 23% | 88% | 18 min |
| Lee County | 32,893 | $62K | $141K | 76% | 22% | 87% | 22 min |
| Linn County | 230,004 | $78K | $214K | 74% | 35% | 92% | 21 min |
| Louisa County | 10,678 | $77K | $150K | 80% | 17% | 88% | 29 min |
| Lucas County | 8,716 | $62K | $120K | 79% | 16% | 80% | 25 min |
| Lyon County | 12,162 | $77K | $230K | 81% | 20% | 90% | 20 min |
| Madison County | 16,926 | $91K | $245K | 80% | 27% | 90% | 30 min |
| Mahaska County | 22,021 | $71K | $158K | 68% | 24% | 90% | 19 min |
| Marion County | 33,642 | $79K | $233K | 78% | 32% | 88% | 23 min |
| Marshall County | 40,114 | $73K | $146K | 75% | 23% | 88% | 21 min |
| Mills County | 14,568 | $91K | $238K | 84% | 31% | 89% | 28 min |
| Mitchell County | 10,575 | $71K | $175K | 80% | 25% | 90% | 20 min |
| Monona County | 8,557 | $68K | $143K | 76% | 20% | 85% | 24 min |
| Monroe County | 7,513 | $71K | $156K | 81% | 21% | 86% | 32 min |
| Montgomery County | 10,214 | $64K | $121K | 69% | 20% | 86% | 25 min |
| Muscatine County | 42,559 | $69K | $182K | 74% | 23% | 90% | 20 min |
| O'Brien County | 14,126 | $68K | $173K | 76% | 22% | 90% | 21 min |
| Osceola County | 6,100 | $69K | $123K | 78% | 17% | 86% | 19 min |
| Page County | 15,131 | $58K | $125K | 71% | 19% | 87% | 19 min |
| Palo Alto County | 8,863 | $73K | $123K | 77% | 19% | 90% | 18 min |
| Plymouth County | 25,747 | $83K | $229K | 74% | 22% | 90% | 21 min |
| Pocahontas County | 7,046 | $62K | $98K | 77% | 19% | 86% | 22 min |
| Polk County | 503,175 | $84K | $262K | 67% | 40% | 92% | 22 min |
| Pottawattamie County | 93,424 | $74K | $196K | 70% | 24% | 86% | 21 min |
| Poweshiek County | 18,545 | $67K | $209K | 71% | 27% | 87% | 20 min |
| Ringgold County | 4,645 | $73K | $156K | 79% | 25% | 87% | 23 min |
| Sac County | 9,689 | $74K | $141K | 78% | 22% | 85% | 23 min |
| Scott County | 174,608 | $78K | $222K | 70% | 37% | 91% | 22 min |
| Shelby County | 11,778 | $73K | $164K | 78% | 24% | 88% | 20 min |
| Sioux County | 36,212 | $86K | $250K | 76% | 31% | 92% | 15 min |
| Story County | 100,466 | $70K | $259K | 56% | 55% | 80% | 19 min |
| Tama County | 16,868 | $71K | $149K | 76% | 21% | 88% | 24 min |
| Taylor County | 5,868 | $68K | $117K | 78% | 16% | 85% | 22 min |
| Union County | 11,993 | $58K | $122K | 72% | 23% | 85% | 17 min |
| Van Buren County | 7,241 | $61K | $115K | 82% | 19% | 73% | 24 min |
| Wapello County | 35,362 | $65K | $125K | 68% | 20% | 86% | 21 min |
| Warren County | 54,409 | $95K | $270K | 82% | 33% | 92% | 26 min |
| Washington County | 22,561 | $76K | $204K | 74% | 26% | 89% | 24 min |
| Wayne County | 6,532 | $62K | $111K | 81% | 17% | 79% | 26 min |
| Webster County | 36,886 | $69K | $154K | 70% | 22% | 87% | 21 min |
| Winnebago County | 10,583 | $68K | $135K | 71% | 26% | 89% | 16 min |
| Winneshiek County | 19,873 | $79K | $259K | 74% | 31% | 88% | 19 min |
| Woodbury County | 106,247 | $74K | $183K | 68% | 24% | 87% | 19 min |
| Worth County | 7,350 | $78K | $146K | 83% | 19% | 85% | 23 min |
| Wright County | 12,791 | $67K | $120K | 77% | 25% | 86% | 22 min |
Source: U.S. Census Bureau, American Community Survey 2020–2024 5-year estimates
People.
3,210,507 residents in 1,315,707 households, next to the United States figure.
Source: U.S. Census Bureau, American Community Survey 2020–2024 5-year estimates
Homes.
1,437,699 housing units; the median owner-occupied home is valued at $208,000 (±$1,141).
When homes were built
Source: U.S. Census Bureau, American Community Survey 2020–2024 5-year estimates
Income and work.
Household income and work, in 2024 dollars; median household income ±$418.
The poverty rate uses the federal poverty thresholds, which vary with family size. It says nothing on its own about what a neighborhood is like to live in.
Source: U.S. Census Bureau, American Community Survey 2020–2024 5-year estimates
Getting around.
How workers aged 16 and over get to work, and how long it takes.
Source: U.S. Census Bureau, American Community Survey 2020–2024 5-year estimates
Internet.
Home internet subscriptions.
American Community Survey figures are estimates from a rolling sample, averaged over 2020–2024. Each comes with a margin of error, which is wider in places with fewer people.
Source: U.S. Census Bureau, American Community Survey 2020–2024 5-year estimates
Counties in Iowa.
Every county has its own page, with all of its ZIP codes.