Kansas
Kansas has 2,947,197 residents in 105 counties and 660 ZIP codes. The median household income is $74,275, 8% below the national figure, and the typical owner-occupied home is valued at $217,200. 67% of households own their home.
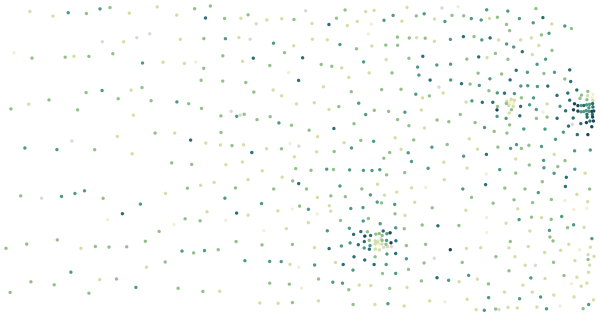
Sources: U.S. Census Bureau, American Community Survey 2020–2024 5-year estimates · U.S. Census Bureau, 2024 Gazetteer and 2020 ZCTA relationship files
All 105 counties.
Colour shows where each county sits among the others in the table, from lowest to highest.
| County | Residents | Household income | Home value | Owners | Bachelor's+ | Broadband | Commute |
|---|---|---|---|---|---|---|---|
| Allen County | 12,483 | $61K | $108K | 75% | 22% | 84% | 20 min |
| Anderson County | 7,834 | $71K | $171K | 79% | 14% | 76% | 29 min |
| Atchison County | 16,208 | $61K | $146K | 72% | 22% | 88% | 24 min |
| Barber County | 4,069 | $62K | $97K | 81% | 27% | 85% | 16 min |
| Barton County | 25,097 | $59K | $126K | 65% | 22% | 87% | 16 min |
| Bourbon County | 14,394 | $59K | $114K | 74% | 24% | 88% | 22 min |
| Brown County | 9,343 | $62K | $118K | 76% | 20% | 87% | 19 min |
| Butler County | 68,287 | $82K | $218K | 78% | 32% | 90% | 25 min |
| Chase County | 2,561 | $56K | $110K | 73% | 30% | 85% | 21 min |
| Chautauqua County | 3,370 | $56K | $66K | 82% | 19% | 82% | 24 min |
| Cherokee County | 19,151 | $58K | $100K | 76% | 19% | 87% | 22 min |
| Cheyenne County | 2,628 | $55K | $126K | 78% | 22% | 83% | 15 min |
| Clark County | 1,974 | $63K | $88K | 74% | 31% | 89% | 20 min |
| Clay County | 8,048 | $66K | $156K | 78% | 26% | 90% | 26 min |
| Cloud County | 8,898 | $59K | $100K | 74% | 21% | 84% | 18 min |
| Coffey County | 8,308 | $70K | $157K | 76% | 20% | 87% | 23 min |
| Comanche County | 1,729 | $55K | $70K | 73% | 20% | 89% | 16 min |
| Cowley County | 34,411 | $58K | $121K | 68% | 25% | 84% | 22 min |
| Crawford County | 39,008 | $53K | $133K | 61% | 32% | 89% | 19 min |
| Decatur County | 2,726 | $54K | $90K | 78% | 27% | 89% | 20 min |
| Dickinson County | 18,445 | $68K | $147K | 79% | 24% | 89% | 24 min |
| Doniphan County | 7,503 | $74K | $135K | 81% | 22% | 87% | 23 min |
| Douglas County | 120,302 | $70K | $309K | 50% | 53% | 92% | 23 min |
| Edwards County | 2,779 | $53K | $71K | 79% | 21% | 83% | 22 min |
| Elk County | 2,453 | $65K | $69K | 79% | 22% | 86% | 32 min |
| Ellis County | 28,920 | $63K | $216K | 63% | 39% | 93% | 14 min |
| Ellsworth County | 6,360 | $66K | $115K | 80% | 23% | 88% | 21 min |
| Finney County | 38,084 | $73K | $201K | 65% | 19% | 92% | 16 min |
| Ford County | 34,074 | $71K | $151K | 63% | 21% | 87% | 14 min |
| Franklin County | 26,106 | $77K | $199K | 72% | 25% | 86% | 26 min |
| Geary County | 35,815 | $59K | $173K | 44% | 26% | 94% | 19 min |
| Gove County | 2,799 | $66K | $118K | 79% | 24% | 82% | 18 min |
| Graham County | 2,389 | $51K | $90K | 79% | 27% | 87% | 13 min |
| Grant County | 7,229 | $66K | $110K | 77% | 25% | 91% | 27 min |
| Gray County | 5,701 | $79K | $206K | 77% | 26% | 88% | 19 min |
| Greeley County | 1,304 | $81K | $115K | 75% | 30% | 95% | 16 min |
| Greenwood County | 5,919 | $60K | $89K | 81% | 22% | 82% | 27 min |
| Hamilton County | 2,471 | $70K | $116K | 77% | 21% | 88% | 17 min |
| Harper County | 5,400 | $53K | $84K | 75% | 23% | 83% | 17 min |
| Harvey County | 33,756 | $74K | $180K | 70% | 30% | 87% | 22 min |
| Haskell County | 3,641 | $66K | $165K | 76% | 20% | 84% | 18 min |
| Hodgeman County | 1,652 | $60K | $102K | 79% | 30% | 83% | 17 min |
| Jackson County | 13,341 | $75K | $207K | 77% | 23% | 86% | 28 min |
| Jefferson County | 18,349 | $81K | $217K | 86% | 25% | 89% | 32 min |
| Jewell County | 2,916 | $53K | $65K | 74% | 18% | 82% | 18 min |
| Johnson County | 620,631 | $109K | $391K | 69% | 58% | 96% | 22 min |
| Kearny County | 3,864 | $89K | $201K | 72% | 19% | 93% | 24 min |
| Kingman County | 7,186 | $60K | $111K | 66% | 25% | 83% | 25 min |
| Kiowa County | 2,422 | $76K | $155K | 73% | 28% | 84% | 15 min |
| Labette County | 19,869 | $56K | $95K | 74% | 20% | 83% | 18 min |
| Lane County | 1,461 | $55K | $127K | 89% | 24% | 84% | 14 min |
| Leavenworth County | 83,123 | $89K | $283K | 69% | 36% | 92% | 26 min |
| Lincoln County | 2,923 | $58K | $97K | 80% | 26% | 84% | 21 min |
| Linn County | 9,767 | $59K | $174K | 81% | 23% | 84% | 37 min |
| Logan County | 2,707 | $76K | $118K | 65% | 26% | 93% | 19 min |
| Lyon County | 32,186 | $60K | $151K | 58% | 26% | 89% | 17 min |
| Marion County | 11,754 | $65K | $124K | 81% | 30% | 85% | 23 min |
| Marshall County | 9,993 | $68K | $128K | 80% | 19% | 85% | 18 min |
| McPherson County | 30,205 | $79K | $211K | 76% | 34% | 89% | 16 min |
| Meade County | 3,903 | $72K | $149K | 74% | 27% | 89% | 19 min |
| Miami County | 34,938 | $89K | $288K | 78% | 31% | 87% | 32 min |
| Mitchell County | 5,779 | $64K | $134K | 69% | 26% | 85% | 15 min |
| Montgomery County | 30,940 | $56K | $102K | 73% | 23% | 87% | 20 min |
| Morris County | 5,340 | $59K | $130K | 80% | 30% | 85% | 24 min |
| Morton County | 2,611 | $66K | $96K | 85% | 17% | 85% | 18 min |
| Nemaha County | 10,160 | $77K | $217K | 78% | 30% | 88% | 16 min |
| Neosho County | 15,656 | $57K | $111K | 77% | 23% | 86% | 18 min |
| Ness County | 2,653 | $69K | $90K | 82% | 25% | 89% | 16 min |
| Norton County | 5,359 | $54K | $102K | 76% | 23% | 93% | 13 min |
| Osage County | 15,744 | $74K | $157K | 82% | 22% | 85% | 31 min |
| Osborne County | 3,452 | $63K | $86K | 77% | 24% | 84% | 14 min |
| Ottawa County | 5,819 | $74K | $166K | 77% | 28% | 88% | 24 min |
| Pawnee County | 6,144 | $64K | $93K | 66% | 18% | 90% | 19 min |
| Phillips County | 4,813 | $62K | $97K | 78% | 23% | 88% | 20 min |
| Pottawatomie County | 26,204 | $92K | $246K | 82% | 38% | 93% | 25 min |
| Pratt County | 9,127 | $66K | $115K | 73% | 26% | 84% | 14 min |
| Rawlins County | 2,516 | $68K | $104K | 71% | 20% | 86% | 14 min |
| Reno County | 61,553 | $61K | $133K | 69% | 20% | 84% | 19 min |
| Republic County | 4,646 | $57K | $76K | 78% | 22% | 78% | 18 min |
| Rice County | 9,350 | $64K | $105K | 77% | 26% | 90% | 21 min |
| Riley County | 71,946 | $61K | $237K | 46% | 49% | 92% | 17 min |
| Rooks County | 4,813 | $63K | $89K | 74% | 23% | 83% | 16 min |
| Rush County | 2,947 | $60K | $84K | 78% | 21% | 90% | 24 min |
| Russell County | 6,679 | $62K | $119K | 75% | 20% | 91% | 14 min |
| Saline County | 53,668 | $65K | $180K | 67% | 29% | 90% | 17 min |
| Scott County | 5,027 | $69K | $160K | 67% | 29% | 89% | 12 min |
| Sedgwick County | 528,226 | $69K | $203K | 63% | 32% | 92% | 21 min |
| Seward County | 21,486 | $64K | $137K | 62% | 11% | 87% | 16 min |
| Shawnee County | 178,025 | $67K | $181K | 67% | 32% | 89% | 20 min |
| Sheridan County | 2,426 | $74K | $167K | 77% | 24% | 91% | 16 min |
| Sherman County | 5,858 | $62K | $137K | 66% | 24% | 91% | 15 min |
| Smith County | 3,552 | $59K | $94K | 85% | 26% | 86% | 15 min |
| Stafford County | 3,978 | $64K | $98K | 82% | 27% | 87% | 23 min |
| Stanton County | 2,038 | $72K | $68K | 77% | 24% | 90% | 15 min |
| Stevens County | 5,162 | $64K | $129K | 75% | 20% | 89% | 17 min |
| Sumner County | 22,353 | $64K | $135K | 75% | 26% | 85% | 26 min |
| Thomas County | 7,885 | $71K | $173K | 75% | 35% | 88% | 13 min |
| Trego County | 2,777 | $82K | $121K | 82% | 30% | 92% | 18 min |
| Wabaunsee County | 7,009 | $77K | $177K | 81% | 25% | 87% | 31 min |
| Wallace County | 1,417 | $63K | $105K | 75% | 25% | 91% | 18 min |
| Washington County | 5,533 | $65K | $117K | 79% | 26% | 81% | 21 min |
| Wichita County | 2,091 | $79K | $99K | 78% | 20% | 90% | 12 min |
| Wilson County | 8,505 | $61K | $94K | 78% | 20% | 84% | 21 min |
| Woodson County | 3,109 | $50K | $81K | 85% | 23% | 85% | 22 min |
| Wyandotte County | 167,654 | $64K | $172K | 62% | 21% | 89% | 24 min |
Source: U.S. Census Bureau, American Community Survey 2020–2024 5-year estimates
People.
2,947,197 residents in 1,174,060 households, next to the United States figure.
Source: U.S. Census Bureau, American Community Survey 2020–2024 5-year estimates
Homes.
1,293,635 housing units; the median owner-occupied home is valued at $217,200 (±$1,343).
When homes were built
Source: U.S. Census Bureau, American Community Survey 2020–2024 5-year estimates
Income and work.
Household income and work, in 2024 dollars; median household income ±$475.
The poverty rate uses the federal poverty thresholds, which vary with family size. It says nothing on its own about what a neighborhood is like to live in.
Source: U.S. Census Bureau, American Community Survey 2020–2024 5-year estimates
Getting around.
How workers aged 16 and over get to work, and how long it takes.
Source: U.S. Census Bureau, American Community Survey 2020–2024 5-year estimates
Internet.
Home internet subscriptions.
American Community Survey figures are estimates from a rolling sample, averaged over 2020–2024. Each comes with a margin of error, which is wider in places with fewer people.
Source: U.S. Census Bureau, American Community Survey 2020–2024 5-year estimates
Counties in Kansas.
Every county has its own page, with all of its ZIP codes.