Missouri
Missouri has 6,191,814 residents in 115 counties and 968 ZIP codes. The median household income is $70,702, 12% below the national figure, and the typical owner-occupied home is valued at $230,300. 68% of households own their home.
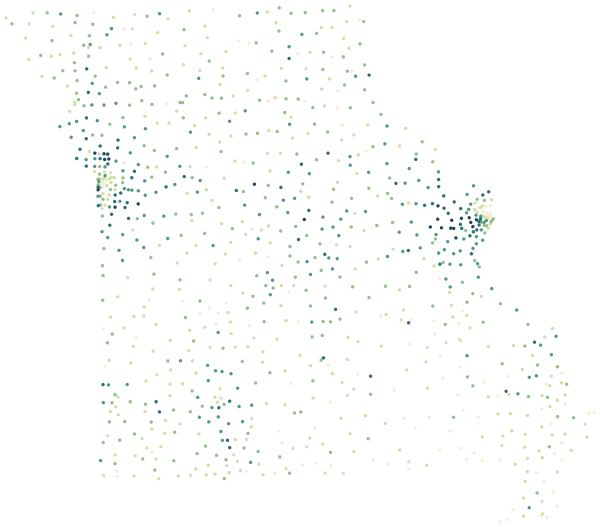
Sources: U.S. Census Bureau, American Community Survey 2020–2024 5-year estimates · U.S. Census Bureau, 2024 Gazetteer and 2020 ZCTA relationship files
All 115 counties.
Colour shows where each county sits among the others in the table, from lowest to highest.
| County | Residents | Household income | Home value | Owners | Bachelor's+ | Broadband | Commute |
|---|---|---|---|---|---|---|---|
| Adair County | 25,301 | $62K | $166K | 61% | 36% | 81% | 17 min |
| Andrew County | 18,065 | $76K | $215K | 77% | 29% | 86% | 23 min |
| Atchison County | 5,187 | $59K | $107K | 77% | 22% | 88% | 22 min |
| Audrain County | 24,548 | $59K | $143K | 72% | 17% | 86% | 24 min |
| Barry County | 35,033 | $58K | $188K | 77% | 15% | 85% | 26 min |
| Barton County | 11,690 | $52K | $137K | 68% | 17% | 83% | 25 min |
| Bates County | 16,186 | $61K | $171K | 75% | 15% | 85% | 35 min |
| Benton County | 20,151 | $53K | $178K | 84% | 15% | 83% | 32 min |
| Bollinger County | 10,559 | $64K | $180K | 82% | 14% | 81% | 38 min |
| Boone County | 188,043 | $73K | $273K | 58% | 52% | 91% | 20 min |
| Buchanan County | 83,568 | $62K | $166K | 66% | 24% | 86% | 20 min |
| Butler County | 42,020 | $49K | $145K | 65% | 16% | 84% | 22 min |
| Caldwell County | 8,927 | $65K | $167K | 78% | 20% | 81% | 35 min |
| Callaway County | 44,741 | $74K | $202K | 76% | 25% | 90% | 25 min |
| Camden County | 43,667 | $66K | $305K | 83% | 26% | 87% | 24 min |
| Cape Girardeau County | 82,735 | $68K | $221K | 67% | 33% | 90% | 21 min |
| Carroll County | 8,411 | $62K | $118K | 72% | 19% | 77% | 27 min |
| Carter County | 5,297 | $50K | $159K | 61% | 10% | 83% | 25 min |
| Cass County | 110,773 | $88K | $292K | 76% | 30% | 93% | 30 min |
| Cedar County | 14,615 | $48K | $168K | 74% | 19% | 82% | 27 min |
| Chariton County | 7,390 | $72K | $161K | 84% | 23% | 86% | 25 min |
| Christian County | 92,915 | $83K | $275K | 76% | 33% | 92% | 27 min |
| Clark County | 6,675 | $52K | $131K | 78% | 15% | 75% | 28 min |
| Clay County | 258,122 | $88K | $276K | 70% | 37% | 91% | 25 min |
| Clinton County | 21,414 | $71K | $227K | 76% | 22% | 86% | 30 min |
| Cole County | 77,032 | $75K | $230K | 68% | 39% | 90% | 20 min |
| Cooper County | 16,824 | $71K | $204K | 76% | 24% | 88% | 28 min |
| Crawford County | 22,797 | $58K | $173K | 69% | 14% | 82% | 31 min |
| Dade County | 7,641 | $54K | $171K | 77% | 15% | 82% | 30 min |
| Dallas County | 17,551 | $53K | $190K | 76% | 16% | 82% | 34 min |
| Daviess County | 8,477 | $64K | $162K | 79% | 18% | 78% | 33 min |
| DeKalb County | 10,876 | $70K | $169K | 71% | 16% | 83% | 31 min |
| Dent County | 14,539 | $56K | $168K | 76% | 17% | 77% | 23 min |
| Douglas County | 11,965 | $46K | $168K | 81% | 15% | 81% | 30 min |
| Dunklin County | 27,493 | $48K | $98K | 62% | 13% | 89% | 25 min |
| Franklin County | 105,950 | $73K | $228K | 77% | 24% | 90% | 30 min |
| Gasconade County | 14,746 | $64K | $180K | 81% | 18% | 85% | 30 min |
| Gentry County | 6,245 | $56K | $134K | 74% | 22% | 85% | 25 min |
| Greene County | 303,375 | $61K | $221K | 58% | 34% | 87% | 21 min |
| Grundy County | 9,787 | $52K | $113K | 70% | 17% | 78% | 20 min |
| Harrison County | 8,190 | $54K | $110K | 71% | 16% | 83% | 24 min |
| Henry County | 22,328 | $58K | $161K | 75% | 16% | 85% | 23 min |
| Hickory County | 8,585 | $39K | $176K | 82% | 13% | 72% | 33 min |
| Holt County | 4,240 | $61K | $138K | 77% | 20% | 82% | 25 min |
| Howard County | 10,147 | $66K | $159K | 79% | 28% | 86% | 28 min |
| Howell County | 40,383 | $51K | $173K | 70% | 18% | 86% | 24 min |
| Iron County | 9,446 | $49K | $119K | 75% | 19% | 82% | 28 min |
| Jackson County | 719,976 | $69K | $231K | 59% | 34% | 91% | 25 min |
| Jasper County | 124,357 | $61K | $167K | 63% | 25% | 89% | 21 min |
| Jefferson County | 229,458 | $83K | $237K | 82% | 25% | 92% | 33 min |
| Johnson County | 54,732 | $67K | $236K | 64% | 29% | 91% | 25 min |
| Knox County | 3,756 | $58K | $101K | 85% | 16% | 71% | 21 min |
| Laclede County | 36,390 | $53K | $168K | 68% | 16% | 77% | 23 min |
| Lafayette County | 33,115 | $81K | $217K | 76% | 26% | 87% | 27 min |
| Lawrence County | 38,593 | $61K | $175K | 74% | 17% | 85% | 27 min |
| Lewis County | 9,924 | $60K | $130K | 76% | 17% | 74% | 25 min |
| Lincoln County | 63,057 | $89K | $244K | 79% | 18% | 92% | 34 min |
| Linn County | 11,852 | $62K | $123K | 79% | 19% | 78% | 21 min |
| Livingston County | 14,364 | $64K | $148K | 72% | 18% | 77% | 21 min |
| Macon County | 15,163 | $62K | $149K | 77% | 19% | 81% | 24 min |
| Madison County | 12,729 | $54K | $159K | 74% | 16% | 84% | 25 min |
| Maries County | 8,450 | $59K | $219K | 78% | 16% | 78% | 37 min |
| Marion County | 28,457 | $63K | $162K | 69% | 25% | 88% | 19 min |
| McDonald County | 23,701 | $52K | $155K | 67% | 12% | 79% | 29 min |
| Mercer County | 3,482 | $63K | $105K | 81% | 18% | 81% | 25 min |
| Miller County | 25,269 | $57K | $193K | 74% | 19% | 84% | 30 min |
| Mississippi County | 11,902 | $48K | $109K | 63% | 15% | 92% | 23 min |
| Moniteau County | 15,262 | $66K | $182K | 79% | 16% | 81% | 27 min |
| Monroe County | 8,734 | $55K | $149K | 74% | 19% | 85% | 27 min |
| Montgomery County | 11,426 | $66K | $179K | 73% | 18% | 85% | 31 min |
| Morgan County | 21,717 | $53K | $194K | 80% | 17% | 80% | 30 min |
| New Madrid County | 15,731 | $52K | $112K | 64% | 15% | 89% | 23 min |
| Newton County | 60,118 | $66K | $191K | 77% | 24% | 88% | 24 min |
| Nodaway County | 20,774 | $59K | $178K | 62% | 28% | 86% | 17 min |
| Oregon County | 8,673 | $43K | $113K | 75% | 13% | 77% | 24 min |
| Osage County | 13,402 | $77K | $223K | 79% | 25% | 84% | 28 min |
| Ozark County | 8,873 | $44K | $169K | 82% | 15% | 79% | 31 min |
| Pemiscot County | 14,958 | $40K | $97K | 56% | 13% | 85% | 22 min |
| Perry County | 18,976 | $63K | $188K | 77% | 21% | 85% | 23 min |
| Pettis County | 43,397 | $60K | $166K | 69% | 18% | 89% | 20 min |
| Phelps County | 45,194 | $58K | $207K | 62% | 32% | 89% | 20 min |
| Pike County | 17,711 | $55K | $146K | 73% | 17% | 86% | 25 min |
| Platte County | 110,371 | $96K | $345K | 67% | 47% | 93% | 26 min |
| Polk County | 32,444 | $60K | $206K | 72% | 23% | 82% | 29 min |
| Pulaski County | 53,894 | $64K | $190K | 61% | 26% | 84% | 21 min |
| Putnam County | 4,642 | $64K | $120K | 83% | 23% | 76% | 21 min |
| Ralls County | 10,428 | $65K | $168K | 86% | 17% | 88% | 23 min |
| Randolph County | 24,365 | $53K | $159K | 71% | 18% | 84% | 23 min |
| Ray County | 23,145 | $75K | $199K | 77% | 16% | 84% | 35 min |
| Reynolds County | 6,010 | $45K | $152K | 80% | 15% | 80% | 28 min |
| Ripley County | 10,708 | $42K | $120K | 79% | 13% | 83% | 35 min |
| Saline County | 23,231 | $58K | $151K | 70% | 23% | 86% | 19 min |
| Schuyler County | 4,038 | $61K | $138K | 80% | 12% | 69% | 30 min |
| Scotland County | 4,686 | $69K | $159K | 82% | 15% | 82% | 21 min |
| Scott County | 37,933 | $63K | $154K | 71% | 22% | 89% | 20 min |
| Shannon County | 7,177 | $55K | $158K | 80% | 13% | 83% | 29 min |
| Shelby County | 5,986 | $52K | $100K | 78% | 19% | 84% | 22 min |
| St. Charles County | 414,535 | $105K | $321K | 81% | 43% | 95% | 26 min |
| St. Clair County | 9,587 | $53K | $157K | 76% | 15% | 82% | 29 min |
| St. Francois County | 66,999 | $57K | $169K | 68% | 17% | 86% | 28 min |
| St. Louis County | 995,569 | $83K | $277K | 69% | 47% | 93% | 25 min |
| St. Louis city | 288,512 | $56K | $198K | 45% | 41% | 87% | 24 min |
| Ste. Genevieve County | 18,571 | $66K | $222K | 83% | 17% | 85% | 33 min |
| Stoddard County | 28,470 | $58K | $143K | 72% | 17% | 87% | 25 min |
| Stone County | 32,048 | $64K | $249K | 83% | 25% | 89% | 29 min |
| Sullivan County | 5,857 | $57K | $116K | 75% | 16% | 79% | 21 min |
| Taney County | 56,529 | $56K | $219K | 67% | 25% | 89% | 25 min |
| Texas County | 25,161 | $50K | $147K | 77% | 17% | 80% | 27 min |
| Vernon County | 19,687 | $52K | $159K | 71% | 17% | 84% | 21 min |
| Warren County | 37,177 | $81K | $260K | 80% | 20% | 92% | 34 min |
| Washington County | 23,470 | $56K | $129K | 78% | 12% | 83% | 41 min |
| Wayne County | 10,862 | $47K | $107K | 75% | 13% | 82% | 32 min |
| Webster County | 40,500 | $71K | $229K | 77% | 18% | 82% | 29 min |
| Worth County | 1,934 | $48K | $97K | 82% | 21% | 85% | 26 min |
| Wright County | 18,965 | $48K | $160K | 77% | 16% | 80% | 31 min |
Source: U.S. Census Bureau, American Community Survey 2020–2024 5-year estimates
People.
6,191,814 residents in 2,508,227 households, next to the United States figure.
Source: U.S. Census Bureau, American Community Survey 2020–2024 5-year estimates
Homes.
2,825,287 housing units; the median owner-occupied home is valued at $230,300 (±$880).
When homes were built
Source: U.S. Census Bureau, American Community Survey 2020–2024 5-year estimates
Income and work.
Household income and work, in 2024 dollars; median household income ±$325.
The poverty rate uses the federal poverty thresholds, which vary with family size. It says nothing on its own about what a neighborhood is like to live in.
Source: U.S. Census Bureau, American Community Survey 2020–2024 5-year estimates
Getting around.
How workers aged 16 and over get to work, and how long it takes.
Source: U.S. Census Bureau, American Community Survey 2020–2024 5-year estimates
Internet.
Home internet subscriptions.
American Community Survey figures are estimates from a rolling sample, averaged over 2020–2024. Each comes with a margin of error, which is wider in places with fewer people.
Source: U.S. Census Bureau, American Community Survey 2020–2024 5-year estimates
Counties in Missouri.
Every county has its own page, with all of its ZIP codes.