Kings County
Kings County has 2,631,580 residents across 38 ZIP codes with their own report. Median household income is $80,263, 7% below the New York figure. The typical owner-occupied home is valued at $905,000, and 42% of adults 25 and over hold a bachelor’s degree or higher.
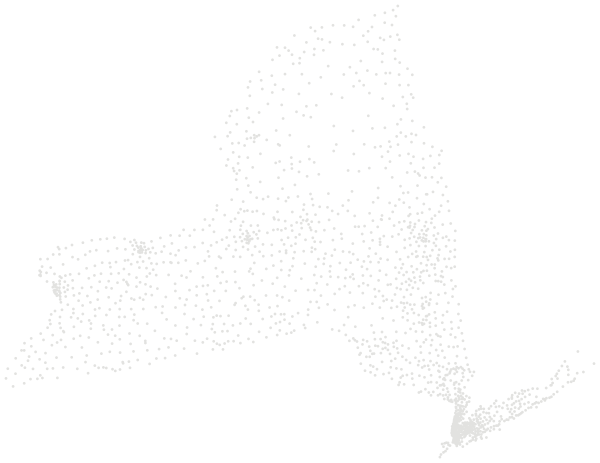

Sources: U.S. Census Bureau, American Community Survey 2020–2024 5-year estimates · U.S. Census Bureau, 2024 Gazetteer and 2020 ZCTA relationship files
All 38 ZIP codes.
Colour shows where each zip code sits among the others in the table, from lowest to highest.
| ZIP code | Residents | Household income | Home value | Owners | Bachelor's+ | Broadband | Commute |
|---|---|---|---|---|---|---|---|
| 11201 | 70,674 | $173K | $1.11M | 36% | 80% | 95% | 35 min |
| 11203 | 74,817 | $68K | $720K | 40% | 28% | 93% | 50 min |
| 11204 | 79,800 | $69K | $1.10M | 35% | 30% | 86% | 45 min |
| 11205 | 51,676 | $94K | $917K | 28% | 53% | 87% | 41 min |
| 11206 | 93,020 | $61K | $840K | 11% | 36% | 83% | 40 min |
| 11207 | 93,198 | $57K | $657K | 26% | 20% | 87% | 48 min |
| 11208 | 105,428 | $62K | $680K | 25% | 18% | 94% | 50 min |
| 11209 | 71,004 | $94K | $872K | 36% | 53% | 92% | 49 min |
| 11210 | 57,915 | $84K | $838K | 44% | 39% | 93% | 49 min |
| 11211 | 65,314 | $108K | $1.14M | 17% | 56% | 86% | 35 min |
| 11212 | 89,020 | $41K | $570K | 13% | 16% | 85% | 52 min |
| 11213 | 68,846 | $65K | $1.09M | 17% | 37% | 88% | 47 min |
| 11214 | 89,397 | $66K | $991K | 35% | 33% | 90% | 48 min |
| 11215 | 70,441 | $186K | $1.62M | 42% | 81% | 97% | 42 min |
| 11216 | 60,685 | $101K | $1.29M | 21% | 56% | 93% | 46 min |
| 11217 | 43,490 | $163K | $1.64M | 28% | 72% | 93% | 37 min |
| 11218 | 72,042 | $97K | $936K | 39% | 51% | 90% | 44 min |
| 11219 | 94,196 | $58K | $1.14M | 25% | 20% | 70% | 39 min |
| 11220 | 90,652 | $70K | $1.03M | 27% | 27% | 88% | 47 min |
| 11221 | 91,588 | $86K | $1.09M | 21% | 46% | 90% | 48 min |
| 11222 | 42,853 | $126K | $1.38M | 18% | 66% | 95% | 40 min |
| 11223 | 78,093 | $63K | $1.07M | 36% | 34% | 92% | 49 min |
| 11224 | 50,822 | $44K | $524K | 27% | 35% | 84% | 49 min |
| 11225 | 58,158 | $89K | $1.22M | 20% | 50% | 91% | 43 min |
| 11226 | 95,144 | $81K | $877K | 14% | 38% | 89% | 51 min |
| 11228 | 42,241 | $84K | $1.15M | 56% | 38% | 93% | 47 min |
| 11229 | 78,377 | $71K | $819K | 47% | 42% | 89% | 46 min |
| 11230 | 86,978 | $70K | $875K | 28% | 44% | 86% | 44 min |
| 11231 | 38,276 | $140K | $1.61M | 31% | 68% | 93% | 40 min |
| 11232 | 27,816 | $91K | $941K | 27% | 35% | 93% | 46 min |
| 11233 | 81,822 | $62K | $990K | 24% | 33% | 89% | 43 min |
| 11234 | 83,187 | $97K | $795K | 68% | 40% | 92% | 51 min |
| 11235 | 78,558 | $60K | $721K | 35% | 47% | 88% | 45 min |
| 11236 | 88,051 | $81K | $743K | 52% | 28% | 92% | 55 min |
| 11237 | 45,334 | $85K | $1.08M | 12% | 45% | 92% | 45 min |
| 11238 | 58,345 | $135K | $1.10M | 28% | 73% | 94% | 42 min |
| 11239 | 16,410 | $38K | $573K | 9% | 25% | 81% | 56 min |
| 11249 | 47,728 | $123K | $1.48M | 17% | 60% | 86% | 37 min |
Source: U.S. Census Bureau, American Community Survey 2020–2024 5-year estimates
People.
2,631,580 residents in 1,009,927 households, next to the New York figure.
Source: U.S. Census Bureau, American Community Survey 2020–2024 5-year estimates
Homes.
1,100,772 housing units; the median owner-occupied home is valued at $905,000 (±$7,741).
When homes were built
Source: U.S. Census Bureau, American Community Survey 2020–2024 5-year estimates
Income and work.
Household income and work, in 2024 dollars; median household income ±$946.
The poverty rate uses the federal poverty thresholds, which vary with family size. It says nothing on its own about what a neighborhood is like to live in.
Source: U.S. Census Bureau, American Community Survey 2020–2024 5-year estimates
Getting around.
How workers aged 16 and over get to work, and how long it takes.
Source: U.S. Census Bureau, American Community Survey 2020–2024 5-year estimates
Internet.
Home internet subscriptions.
American Community Survey figures are estimates from a rolling sample, averaged over 2020–2024. Each comes with a margin of error, which is wider in places with fewer people.
Source: U.S. Census Bureau, American Community Survey 2020–2024 5-year estimates
Around here.
Photographs taken near Kings County, New York, shared on Wikimedia Commons under free licences.

i


i
Photo: Metropolitan Transportation Authority of the State of New York · CC BY 2.0
View on Wikimedia Commons


i
Photo: Metropolitan Transportation Authority of the State of New York · CC BY 2.0
View on Wikimedia Commons
