Monroe County
Monroe County has 753,753 residents across 43 ZIP codes with their own report. Median household income is $76,382, 11% below the New York figure. The typical owner-occupied home is valued at $213,700, and 42% of adults 25 and over hold a bachelor’s degree or higher.
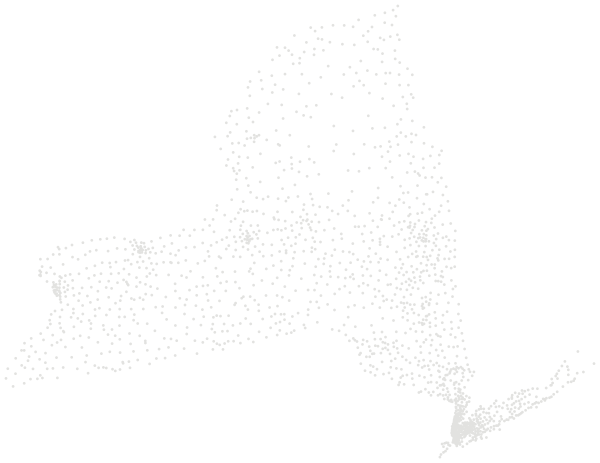

Sources: U.S. Census Bureau, American Community Survey 2020–2024 5-year estimates · U.S. Census Bureau, 2024 Gazetteer and 2020 ZCTA relationship files
All 43 ZIP codes.
Colour shows where each zip code sits among the others in the table, from lowest to highest.
| ZIP code | Residents | Household income | Home value | Owners | Bachelor's+ | Broadband | Commute |
|---|---|---|---|---|---|---|---|
| 14420 | 20,375 | $76K | $192K | 63% | 34% | 90% | 25 min |
| 14428 | 8,127 | $92K | $237K | 86% | 40% | 95% | 25 min |
| 14445 | 7,529 | $74K | $155K | 60% | 40% | 90% | 20 min |
| 14450 | 42,750 | $109K | $308K | 77% | 61% | 95% | 22 min |
| 14464 | 6,755 | $79K | $154K | 88% | 27% | 95% | 29 min |
| 14467 | 10,168 | $89K | $225K | 70% | 45% | 88% | 20 min |
| 14468 | 18,526 | $99K | $230K | 85% | 35% | 93% | 25 min |
| 14472 | 9,039 | $130K | $376K | 80% | 62% | 92% | 27 min |
| 14506 | 923 | $127K | $363K | 89% | 64% | 100% | 22 min |
| 14511 | 548 | $75K | $134K | 100% | 47% | 100% | 33 min |
| 14514 | 6,572 | $86K | $243K | 59% | 48% | 88% | 23 min |
| 14515 | 215 | $-666667K | $95K | 100% | 27% | 100% | 12 min |
| 14526 | 19,629 | $119K | $283K | 84% | 62% | 94% | 22 min |
| 14534 | 33,230 | $144K | $368K | 90% | 73% | 94% | 22 min |
| 14543 | 3,717 | $123K | $256K | 91% | 41% | 97% | 23 min |
| 14546 | 4,450 | $95K | $187K | 66% | 42% | 93% | 23 min |
| 14559 | 17,200 | $95K | $239K | 78% | 39% | 93% | 22 min |
| 14580 | 54,180 | $98K | $279K | 71% | 47% | 91% | 22 min |
| 14586 | 13,291 | $124K | $278K | 78% | 47% | 98% | 23 min |
| 14604 | 3,251 | $52K | $785K | 1% | 54% | 67% | 20 min |
| 14605 | 11,783 | $21K | $83K | 26% | 11% | 77% | 21 min |
| 14606 | 25,538 | $56K | $158K | 62% | 23% | 86% | 20 min |
| 14607 | 17,891 | $60K | $350K | 18% | 60% | 92% | 18 min |
| 14608 | 12,792 | $41K | $187K | 22% | 23% | 85% | 21 min |
| 14609 | 40,274 | $65K | $162K | 64% | 33% | 88% | 22 min |
| 14610 | 14,311 | $86K | $259K | 53% | 66% | 87% | 17 min |
| 14611 | 17,145 | $31K | $82K | 36% | 13% | 82% | 20 min |
| 14612 | 35,152 | $83K | $203K | 73% | 35% | 91% | 23 min |
| 14613 | 15,047 | $38K | $121K | 33% | 12% | 88% | 27 min |
| 14614 | 1,158 | $63K | $-666667K | 9% | 15% | 82% | 19 min |
| 14615 | 17,884 | $51K | $138K | 54% | 21% | 88% | 20 min |
| 14616 | 26,863 | $66K | $147K | 72% | 25% | 90% | 22 min |
| 14617 | 21,788 | $90K | $194K | 85% | 48% | 94% | 22 min |
| 14618 | 25,476 | $125K | $333K | 77% | 74% | 96% | 17 min |
| 14619 | 13,477 | $68K | $135K | 64% | 32% | 93% | 21 min |
| 14620 | 23,769 | $62K | $205K | 29% | 55% | 90% | 18 min |
| 14621 | 32,381 | $35K | $91K | 35% | 12% | 83% | 23 min |
| 14622 | 12,574 | $75K | $171K | 81% | 34% | 92% | 23 min |
| 14623 | 26,032 | $65K | $181K | 51% | 41% | 88% | 16 min |
| 14624 | 38,626 | $88K | $185K | 79% | 34% | 95% | 20 min |
| 14625 | 10,717 | $111K | $245K | 83% | 59% | 97% | 22 min |
| 14626 | 29,273 | $78K | $198K | 68% | 33% | 91% | 20 min |
| 14627 | 3,159 | $-666667K | $-666667K | – | 0% | – | 13 min |
Source: U.S. Census Bureau, American Community Survey 2020–2024 5-year estimates
People.
753,753 residents in 318,428 households, next to the New York figure.
Source: U.S. Census Bureau, American Community Survey 2020–2024 5-year estimates
Homes.
339,430 housing units; the median owner-occupied home is valued at $213,700 (±$2,163).
When homes were built
Source: U.S. Census Bureau, American Community Survey 2020–2024 5-year estimates
Income and work.
Household income and work, in 2024 dollars; median household income ±$1,188.
The poverty rate uses the federal poverty thresholds, which vary with family size. It says nothing on its own about what a neighborhood is like to live in.
Source: U.S. Census Bureau, American Community Survey 2020–2024 5-year estimates
Getting around.
How workers aged 16 and over get to work, and how long it takes.
Source: U.S. Census Bureau, American Community Survey 2020–2024 5-year estimates
Internet.
Home internet subscriptions.
American Community Survey figures are estimates from a rolling sample, averaged over 2020–2024. Each comes with a margin of error, which is wider in places with fewer people.
Source: U.S. Census Bureau, American Community Survey 2020–2024 5-year estimates
Around here.
Photographs taken near Monroe County, New York, shared on Wikimedia Commons under free licences.

i


i


i
Photo: MohawkPhotographer · CC BY-SA 3.0
View on Wikimedia Commons
