Queens County
Queens County has 2,323,052 residents across 62 ZIP codes with their own report. Median household income is $86,136, in line with the New York figure. The typical owner-occupied home is valued at $723,800, and 36% of adults 25 and over hold a bachelor’s degree or higher.
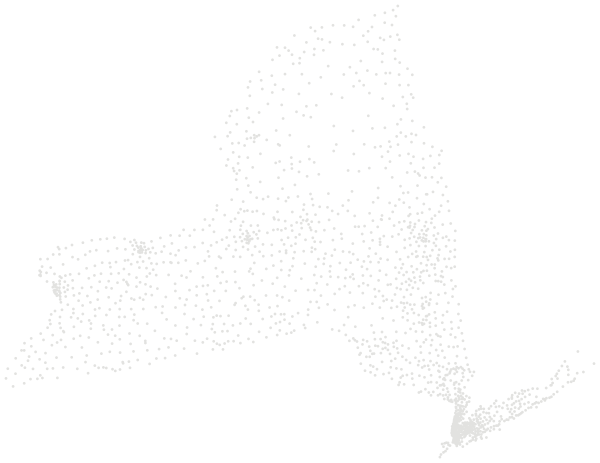

Sources: U.S. Census Bureau, American Community Survey 2020–2024 5-year estimates · U.S. Census Bureau, 2024 Gazetteer and 2020 ZCTA relationship files
All 62 ZIP codes.
Colour shows where each zip code sits among the others in the table, from lowest to highest.
| ZIP code | Residents | Household income | Home value | Owners | Bachelor's+ | Broadband | Commute |
|---|---|---|---|---|---|---|---|
| 11004 | 13,615 | $115K | $697K | 72% | 47% | 95% | 45 min |
| 11005 | 2,174 | $90K | $622K | 95% | 72% | 89% | 35 min |
| 11101 | 42,219 | $121K | $971K | 15% | 68% | 91% | 36 min |
| 11102 | 28,503 | $97K | $719K | 13% | 59% | 95% | 46 min |
| 11103 | 35,163 | $93K | $1.00M | 16% | 53% | 95% | 46 min |
| 11104 | 26,132 | $81K | $610K | 20% | 52% | 93% | 42 min |
| 11105 | 37,936 | $102K | $1.08M | 26% | 55% | 95% | 43 min |
| 11106 | 40,930 | $85K | $610K | 17% | 53% | 93% | 41 min |
| 11109 | 7,948 | $205K | $525K | 19% | 88% | 97% | 36 min |
| 11354 | 53,028 | $66K | $563K | 42% | 36% | 91% | 45 min |
| 11355 | 80,801 | $55K | $675K | 33% | 24% | 88% | 46 min |
| 11356 | 25,824 | $87K | $909K | 50% | 27% | 95% | 50 min |
| 11357 | 43,346 | $97K | $922K | 78% | 39% | 91% | 41 min |
| 11358 | 37,665 | $88K | $974K | 58% | 39% | 94% | 47 min |
| 11360 | 19,469 | $99K | $686K | 76% | 49% | 95% | 47 min |
| 11361 | 30,127 | $106K | $919K | 59% | 46% | 94% | 42 min |
| 11362 | 18,492 | $122K | $531K | 75% | 53% | 94% | 40 min |
| 11363 | 7,223 | $125K | $1.05M | 73% | 56% | 97% | 43 min |
| 11364 | 35,276 | $98K | $806K | 71% | 51% | 93% | 47 min |
| 11365 | 42,322 | $81K | $922K | 46% | 38% | 93% | 44 min |
| 11366 | 13,463 | $135K | $967K | 73% | 55% | 94% | 53 min |
| 11367 | 40,923 | $75K | $494K | 51% | 46% | 94% | 46 min |
| 11368 | 105,716 | $72K | $743K | 23% | 16% | 88% | 51 min |
| 11369 | 35,133 | $80K | $736K | 51% | 22% | 96% | 47 min |
| 11370 | 30,267 | $76K | $851K | 47% | 24% | 93% | 44 min |
| 11372 | 64,756 | $79K | $469K | 37% | 37% | 92% | 44 min |
| 11373 | 98,403 | $71K | $698K | 27% | 29% | 92% | 47 min |
| 11374 | 46,989 | $91K | $473K | 42% | 49% | 93% | 51 min |
| 11375 | 76,839 | $106K | $552K | 51% | 62% | 95% | 50 min |
| 11377 | 81,690 | $73K | $727K | 30% | 34% | 88% | 40 min |
| 11378 | 36,392 | $86K | $834K | 55% | 29% | 94% | 47 min |
| 11379 | 36,773 | $94K | $891K | 60% | 36% | 91% | 48 min |
| 11385 | 101,704 | $89K | $862K | 31% | 35% | 93% | 49 min |
| 11411 | 20,540 | $116K | $647K | 85% | 35% | 95% | 49 min |
| 11412 | 39,828 | $98K | $647K | 72% | 26% | 92% | 52 min |
| 11413 | 45,965 | $118K | $656K | 74% | 31% | 91% | 50 min |
| 11414 | 31,308 | $95K | $661K | 73% | 31% | 91% | 47 min |
| 11415 | 21,154 | $86K | $367K | 45% | 53% | 95% | 46 min |
| 11416 | 25,919 | $81K | $741K | 49% | 24% | 93% | 52 min |
| 11417 | 30,578 | $87K | $746K | 58% | 26% | 91% | 51 min |
| 11418 | 35,481 | $90K | $789K | 48% | 33% | 94% | 50 min |
| 11419 | 47,441 | $93K | $710K | 62% | 19% | 92% | 48 min |
| 11420 | 49,415 | $100K | $707K | 72% | 23% | 94% | 49 min |
| 11421 | 40,612 | $91K | $688K | 55% | 27% | 93% | 52 min |
| 11422 | 33,757 | $115K | $666K | 68% | 35% | 95% | 54 min |
| 11423 | 28,534 | $80K | $733K | 56% | 34% | 89% | 49 min |
| 11426 | 19,411 | $104K | $708K | 70% | 45% | 90% | 44 min |
| 11427 | 24,607 | $89K | $704K | 63% | 37% | 93% | 49 min |
| 11428 | 19,028 | $91K | $684K | 73% | 33% | 90% | 47 min |
| 11429 | 26,832 | $103K | $668K | 73% | 29% | 91% | 48 min |
| 11430 | 588 | $-666667K | $-666667K | – | 0% | – | 66 min |
| 11432 | 62,892 | $74K | $865K | 36% | 36% | 91% | 48 min |
| 11433 | 37,884 | $78K | $659K | 47% | 19% | 93% | 48 min |
| 11434 | 68,263 | $78K | $626K | 48% | 23% | 94% | 52 min |
| 11435 | 56,826 | $80K | $547K | 36% | 34% | 95% | 52 min |
| 11436 | 22,527 | $88K | $640K | 65% | 23% | 89% | 50 min |
| 11439 | 2,170 | $-666667K | $-666667K | – | 35% | – | 30 min |
| 11691 | 69,359 | $56K | $677K | 28% | 25% | 89% | 46 min |
| 11692 | 22,734 | $50K | $710K | 33% | 26% | 90% | 56 min |
| 11693 | 13,244 | $68K | $433K | 49% | 34% | 93% | 54 min |
| 11694 | 21,489 | $111K | $884K | 52% | 48% | 96% | 50 min |
| 11697 | 4,429 | $123K | $720K | 99% | 54% | 96% | 50 min |
Source: U.S. Census Bureau, American Community Survey 2020–2024 5-year estimates
People.
2,323,052 residents in 841,003 households, next to the New York figure.
Source: U.S. Census Bureau, American Community Survey 2020–2024 5-year estimates
Homes.
910,206 housing units; the median owner-occupied home is valued at $723,800 (±$6,606).
When homes were built
Source: U.S. Census Bureau, American Community Survey 2020–2024 5-year estimates
Income and work.
Household income and work, in 2024 dollars; median household income ±$875.
The poverty rate uses the federal poverty thresholds, which vary with family size. It says nothing on its own about what a neighborhood is like to live in.
Source: U.S. Census Bureau, American Community Survey 2020–2024 5-year estimates
Getting around.
How workers aged 16 and over get to work, and how long it takes.
Source: U.S. Census Bureau, American Community Survey 2020–2024 5-year estimates
Internet.
Home internet subscriptions.
American Community Survey figures are estimates from a rolling sample, averaged over 2020–2024. Each comes with a margin of error, which is wider in places with fewer people.
Source: U.S. Census Bureau, American Community Survey 2020–2024 5-year estimates
Around here.
Photographs taken near Queens County, New York, shared on Wikimedia Commons under free licences.

i


i


