Sullivan County
Sullivan County has 79,721 residents across 46 ZIP codes with their own report. Median household income is $72,382, 16% below the New York figure. The typical owner-occupied home is valued at $249,000, and 30% of adults 25 and over hold a bachelor’s degree or higher.
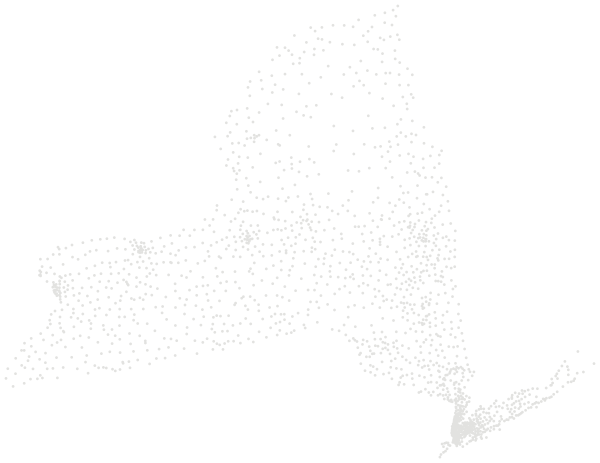

Sources: U.S. Census Bureau, American Community Survey 2020–2024 5-year estimates · U.S. Census Bureau, 2024 Gazetteer and 2020 ZCTA relationship files
All 46 ZIP codes.
Colour shows where each zip code sits among the others in the table, from lowest to highest.
| ZIP code | Residents | Household income | Home value | Owners | Bachelor's+ | Broadband | Commute |
|---|---|---|---|---|---|---|---|
| 12701 | 12,197 | $57K | $203K | 36% | 20% | 88% | 24 min |
| 12719 | 1,339 | $80K | $329K | 84% | 43% | 96% | 39 min |
| 12720 | 447 | $67K | $424K | 64% | 43% | 100% | 31 min |
| 12721 | 7,359 | $103K | $291K | 77% | 30% | 89% | 34 min |
| 12723 | 1,923 | $77K | $236K | 82% | 40% | 87% | 28 min |
| 12726 | 1,168 | $77K | $377K | 89% | 39% | 87% | 37 min |
| 12732 | 776 | $50K | $246K | 93% | 30% | 62% | 44 min |
| 12733 | 1,865 | $56K | $-666667K | 23% | 11% | 21% | 14 min |
| 12734 | 950 | $57K | $383K | 73% | 35% | 92% | 46 min |
| 12736 | 145 | $44K | $154K | 100% | 28% | 75% | 56 min |
| 12737 | 1,513 | $88K | $290K | 96% | 34% | 97% | 34 min |
| 12738 | 423 | $95K | $392K | 50% | 19% | 100% | 13 min |
| 12741 | 222 | $69K | $381K | 49% | 36% | 88% | 30 min |
| 12742 | 253 | $148K | $328K | 89% | 13% | 100% | 11 min |
| 12743 | 279 | $86K | $271K | 100% | 22% | 80% | 20 min |
| 12747 | 2,234 | $72K | $337K | 70% | 32% | 99% | 18 min |
| 12748 | 1,518 | $87K | $243K | 86% | 41% | 92% | 26 min |
| 12749 | 419 | $175K | $171K | 93% | 24% | 93% | 22 min |
| 12751 | 1,407 | $54K | $160K | 59% | 21% | 69% | 33 min |
| 12752 | 309 | $-666667K | $403K | 67% | 39% | 79% | 37 min |
| 12754 | 8,296 | $68K | $224K | 54% | 23% | 90% | 24 min |
| 12758 | 4,025 | $69K | $170K | 84% | 35% | 79% | 29 min |
| 12759 | 1,619 | $42K | $-666667K | 44% | 24% | 96% | 15 min |
| 12762 | 394 | $87K | $-666667K | 67% | 27% | 100% | 17 min |
| 12763 | 890 | $56K | $263K | 78% | 57% | 96% | 25 min |
| 12764 | 1,861 | $68K | $266K | 80% | 46% | 95% | 38 min |
| 12765 | 873 | $-666667K | $377K | 84% | 42% | 97% | 43 min |
| 12766 | 535 | $-666667K | $419K | 96% | 58% | 90% | 39 min |
| 12767 | 156 | $-666667K | $473K | 100% | 35% | 100% | 29 min |
| 12768 | 857 | $35K | $295K | 92% | 24% | 91% | 34 min |
| 12769 | 325 | $142K | $358K | 77% | 31% | 100% | 48 min |
| 12770 | 145 | $108K | $392K | 93% | 59% | 100% | 38 min |
| 12775 | 2,623 | $113K | $398K | 86% | 48% | 96% | 28 min |
| 12777 | 695 | $138K | $354K | 97% | 51% | 94% | 28 min |
| 12778 | 707 | $51K | $171K | 61% | 30% | 97% | 45 min |
| 12779 | 2,205 | $48K | $287K | 46% | 16% | 94% | 13 min |
| 12781 | 177 | $-666667K | $438K | 100% | 42% | 100% | 22 min |
| 12783 | 1,060 | $68K | $248K | 78% | 31% | 81% | 33 min |
| 12785 | 917 | $140K | $240K | 96% | 8% | 87% | 39 min |
| 12786 | 610 | $-666667K | $173K | 67% | 36% | 100% | 32 min |
| 12787 | 192 | $43K | $457K | 80% | 13% | 71% | 23 min |
| 12788 | 3,037 | $63K | $271K | 63% | 16% | 96% | 36 min |
| 12789 | 2,594 | $72K | $171K | 46% | 33% | 97% | 28 min |
| 12790 | 4,537 | $79K | $209K | 74% | 29% | 92% | 36 min |
| 12791 | 763 | $75K | $193K | 75% | 16% | 81% | 20 min |
| 12792 | 163 | $-666667K | $269K | 85% | 40% | 100% | 26 min |
Source: U.S. Census Bureau, American Community Survey 2020–2024 5-year estimates
People.
79,721 residents in 31,434 households, next to the New York figure.
Source: U.S. Census Bureau, American Community Survey 2020–2024 5-year estimates
Homes.
49,994 housing units; the median owner-occupied home is valued at $249,000 (±$8,949).
When homes were built
Source: U.S. Census Bureau, American Community Survey 2020–2024 5-year estimates
Income and work.
Household income and work, in 2024 dollars; median household income ±$5,140.
The poverty rate uses the federal poverty thresholds, which vary with family size. It says nothing on its own about what a neighborhood is like to live in.
Source: U.S. Census Bureau, American Community Survey 2020–2024 5-year estimates
Getting around.
How workers aged 16 and over get to work, and how long it takes.
Source: U.S. Census Bureau, American Community Survey 2020–2024 5-year estimates
Internet.
Home internet subscriptions.
American Community Survey figures are estimates from a rolling sample, averaged over 2020–2024. Each comes with a margin of error, which is wider in places with fewer people.
Source: U.S. Census Bureau, American Community Survey 2020–2024 5-year estimates