Ohio
Ohio has 11,810,293 residents in 88 counties and 1,168 ZIP codes. The median household income is $71,389, 12% below the national figure, and the typical owner-occupied home is valued at $214,800. 67% of households own their home.
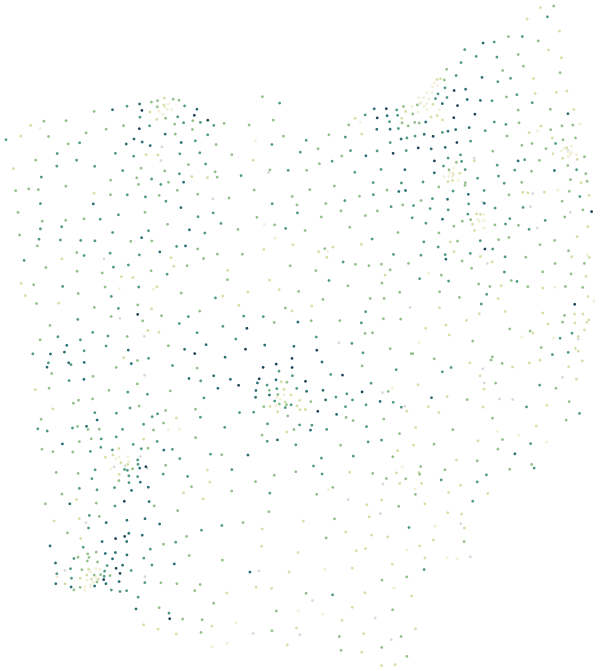
Sources: U.S. Census Bureau, American Community Survey 2020–2024 5-year estimates · U.S. Census Bureau, 2024 Gazetteer and 2020 ZCTA relationship files
All 88 counties.
Colour shows where each county sits among the others in the table, from lowest to highest.
| County | Residents | Household income | Home value | Owners | Bachelor's+ | Broadband | Commute |
|---|---|---|---|---|---|---|---|
| Adams County | 27,540 | $50K | $164K | 72% | 15% | 85% | 37 min |
| Allen County | 101,348 | $64K | $165K | 68% | 20% | 89% | 20 min |
| Ashland County | 52,256 | $70K | $187K | 78% | 23% | 88% | 25 min |
| Ashtabula County | 97,167 | $58K | $160K | 76% | 16% | 88% | 28 min |
| Athens County | 61,737 | $56K | $185K | 60% | 35% | 87% | 24 min |
| Auglaize County | 46,125 | $79K | $190K | 78% | 22% | 88% | 20 min |
| Belmont County | 65,473 | $57K | $155K | 74% | 19% | 86% | 26 min |
| Brown County | 43,845 | $71K | $196K | 77% | 16% | 84% | 37 min |
| Butler County | 392,876 | $82K | $259K | 70% | 33% | 92% | 26 min |
| Carroll County | 26,659 | $65K | $183K | 79% | 16% | 79% | 32 min |
| Champaign County | 38,804 | $76K | $204K | 77% | 19% | 89% | 28 min |
| Clark County | 135,158 | $63K | $170K | 69% | 20% | 90% | 25 min |
| Clermont County | 211,181 | $86K | $266K | 74% | 32% | 93% | 30 min |
| Clinton County | 42,012 | $70K | $212K | 72% | 19% | 87% | 27 min |
| Columbiana County | 100,704 | $58K | $152K | 73% | 17% | 87% | 26 min |
| Coshocton County | 36,744 | $56K | $156K | 73% | 17% | 83% | 26 min |
| Crawford County | 41,711 | $58K | $137K | 73% | 17% | 90% | 25 min |
| Cuyahoga County | 1,245,873 | $64K | $195K | 59% | 37% | 90% | 25 min |
| Darke County | 51,594 | $64K | $173K | 72% | 17% | 87% | 24 min |
| Defiance County | 38,343 | $73K | $163K | 79% | 19% | 88% | 21 min |
| Delaware County | 226,834 | $134K | $446K | 79% | 59% | 96% | 27 min |
| Erie County | 74,581 | $72K | $200K | 72% | 29% | 88% | 23 min |
| Fairfield County | 163,453 | $91K | $299K | 75% | 32% | 93% | 30 min |
| Fayette County | 28,876 | $63K | $171K | 65% | 14% | 85% | 29 min |
| Franklin County | 1,333,048 | $75K | $288K | 53% | 42% | 94% | 23 min |
| Fulton County | 42,240 | $73K | $191K | 80% | 20% | 90% | 25 min |
| Gallia County | 29,068 | $57K | $156K | 75% | 21% | 79% | 27 min |
| Geauga County | 95,481 | $108K | $331K | 87% | 41% | 89% | 29 min |
| Greene County | 169,688 | $87K | $252K | 68% | 42% | 93% | 24 min |
| Guernsey County | 38,223 | $58K | $158K | 72% | 16% | 86% | 24 min |
| Hamilton County | 830,774 | $72K | $242K | 59% | 42% | 91% | 25 min |
| Hancock County | 74,866 | $73K | $205K | 71% | 30% | 91% | 20 min |
| Hardin County | 30,475 | $62K | $151K | 75% | 20% | 86% | 25 min |
| Harrison County | 14,306 | $54K | $122K | 76% | 12% | 83% | 31 min |
| Henry County | 27,567 | $80K | $169K | 83% | 20% | 88% | 25 min |
| Highland County | 43,517 | $66K | $169K | 74% | 16% | 83% | 32 min |
| Hocking County | 27,799 | $63K | $186K | 79% | 14% | 86% | 34 min |
| Holmes County | 44,418 | $76K | $268K | 79% | 11% | 64% | 23 min |
| Huron County | 58,319 | $68K | $166K | 74% | 17% | 88% | 24 min |
| Jackson County | 32,650 | $57K | $151K | 74% | 16% | 84% | 31 min |
| Jefferson County | 64,518 | $59K | $128K | 71% | 20% | 87% | 26 min |
| Knox County | 63,142 | $74K | $239K | 76% | 25% | 89% | 28 min |
| Lake County | 232,216 | $81K | $214K | 76% | 32% | 93% | 25 min |
| Lawrence County | 56,819 | $58K | $144K | 72% | 19% | 85% | 25 min |
| Licking County | 181,837 | $84K | $275K | 74% | 29% | 92% | 28 min |
| Logan County | 46,089 | $72K | $203K | 78% | 19% | 89% | 24 min |
| Lorain County | 317,129 | $73K | $223K | 74% | 29% | 89% | 27 min |
| Lucas County | 428,018 | $62K | $164K | 62% | 29% | 89% | 22 min |
| Madison County | 44,423 | $87K | $250K | 78% | 24% | 91% | 27 min |
| Mahoning County | 226,491 | $57K | $155K | 70% | 27% | 87% | 24 min |
| Marion County | 65,020 | $59K | $157K | 68% | 15% | 87% | 25 min |
| Medina County | 183,660 | $95K | $287K | 80% | 36% | 93% | 28 min |
| Meigs County | 21,896 | $47K | $119K | 75% | 12% | 78% | 33 min |
| Mercer County | 42,484 | $77K | $211K | 80% | 22% | 92% | 20 min |
| Miami County | 110,296 | $77K | $229K | 73% | 27% | 92% | 23 min |
| Monroe County | 13,227 | $60K | $143K | 80% | 12% | 80% | 36 min |
| Montgomery County | 536,096 | $66K | $181K | 63% | 31% | 91% | 23 min |
| Morgan County | 13,651 | $59K | $151K | 79% | 14% | 82% | 41 min |
| Morrow County | 35,404 | $75K | $222K | 81% | 19% | 88% | 34 min |
| Muskingum County | 86,411 | $61K | $182K | 68% | 21% | 89% | 27 min |
| Noble County | 14,282 | $56K | $164K | 84% | 16% | 78% | 24 min |
| Ottawa County | 39,994 | $76K | $220K | 84% | 30% | 88% | 26 min |
| Paulding County | 18,791 | $68K | $141K | 80% | 17% | 82% | 26 min |
| Perry County | 35,535 | $67K | $191K | 76% | 16% | 87% | 36 min |
| Pickaway County | 60,131 | $74K | $257K | 74% | 22% | 90% | 30 min |
| Pike County | 27,044 | $53K | $164K | 69% | 16% | 82% | 31 min |
| Portage County | 161,956 | $76K | $227K | 70% | 33% | 90% | 27 min |
| Preble County | 40,765 | $69K | $181K | 80% | 19% | 88% | 28 min |
| Putnam County | 34,314 | $85K | $201K | 87% | 26% | 88% | 24 min |
| Richland County | 125,099 | $60K | $165K | 68% | 18% | 88% | 23 min |
| Ross County | 76,492 | $61K | $172K | 70% | 17% | 88% | 28 min |
| Sandusky County | 58,778 | $62K | $161K | 73% | 18% | 87% | 22 min |
| Scioto County | 72,627 | $51K | $138K | 68% | 18% | 86% | 29 min |
| Seneca County | 54,770 | $66K | $155K | 73% | 21% | 88% | 22 min |
| Shelby County | 47,929 | $74K | $208K | 74% | 21% | 93% | 21 min |
| Stark County | 373,713 | $68K | $186K | 69% | 26% | 87% | 23 min |
| Summit County | 537,864 | $72K | $209K | 68% | 36% | 92% | 25 min |
| Trumbull County | 200,929 | $56K | $142K | 71% | 21% | 85% | 25 min |
| Tuscarawas County | 92,385 | $65K | $185K | 69% | 20% | 85% | 25 min |
| Union County | 67,324 | $112K | $345K | 79% | 39% | 95% | 27 min |
| Van Wert County | 28,826 | $68K | $152K | 82% | 17% | 89% | 21 min |
| Vinton County | 12,630 | $55K | $150K | 76% | 13% | 80% | 37 min |
| Warren County | 250,008 | $110K | $349K | 79% | 46% | 95% | 27 min |
| Washington County | 58,978 | $64K | $186K | 75% | 22% | 88% | 25 min |
| Wayne County | 116,588 | $74K | $222K | 77% | 25% | 85% | 22 min |
| Williams County | 36,719 | $61K | $150K | 76% | 14% | 86% | 21 min |
| Wood County | 132,064 | $74K | $228K | 64% | 37% | 93% | 22 min |
| Wyandot County | 21,598 | $70K | $163K | 74% | 20% | 88% | 22 min |
Source: U.S. Census Bureau, American Community Survey 2020–2024 5-year estimates
People.
11,810,293 residents in 4,863,191 households, next to the United States figure.
Source: U.S. Census Bureau, American Community Survey 2020–2024 5-year estimates
Homes.
5,292,391 housing units; the median owner-occupied home is valued at $214,800 (±$742).
When homes were built
Source: U.S. Census Bureau, American Community Survey 2020–2024 5-year estimates
Income and work.
Household income and work, in 2024 dollars; median household income ±$321.
The poverty rate uses the federal poverty thresholds, which vary with family size. It says nothing on its own about what a neighborhood is like to live in.
Source: U.S. Census Bureau, American Community Survey 2020–2024 5-year estimates
Getting around.
How workers aged 16 and over get to work, and how long it takes.
Source: U.S. Census Bureau, American Community Survey 2020–2024 5-year estimates
Internet.
Home internet subscriptions.
American Community Survey figures are estimates from a rolling sample, averaged over 2020–2024. Each comes with a margin of error, which is wider in places with fewer people.
Source: U.S. Census Bureau, American Community Survey 2020–2024 5-year estimates
Counties in Ohio.
Every county has its own page, with all of its ZIP codes.