Oklahoma
Oklahoma has 4,028,634 residents in 77 counties and 628 ZIP codes. The median household income is $65,039, 19% below the national figure, and the typical owner-occupied home is valued at $199,800. 66% of households own their home.
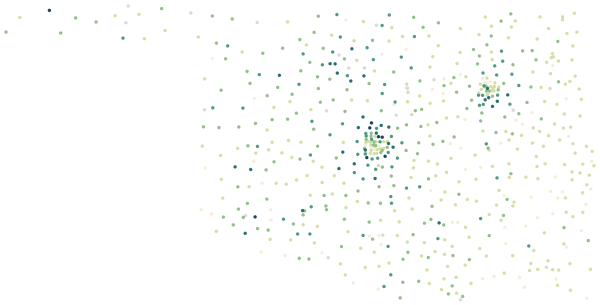
Sources: U.S. Census Bureau, American Community Survey 2020–2024 5-year estimates · U.S. Census Bureau, 2024 Gazetteer and 2020 ZCTA relationship files
All 77 counties.
Colour shows where each county sits among the others in the table, from lowest to highest.
| County | Residents | Household income | Home value | Owners | Bachelor's+ | Broadband | Commute |
|---|---|---|---|---|---|---|---|
| Adair County | 19,575 | $48K | $118K | 69% | 12% | 71% | 27 min |
| Alfalfa County | 5,696 | $65K | $102K | 78% | 20% | 88% | 23 min |
| Atoka County | 14,379 | $55K | $158K | 74% | 17% | 80% | 30 min |
| Beaver County | 5,028 | $64K | $130K | 81% | 22% | 90% | 20 min |
| Beckham County | 22,148 | $53K | $144K | 68% | 13% | 89% | 18 min |
| Blaine County | 8,570 | $62K | $127K | 73% | 18% | 85% | 21 min |
| Bryan County | 48,253 | $57K | $175K | 64% | 27% | 83% | 22 min |
| Caddo County | 26,447 | $55K | $116K | 73% | 16% | 84% | 25 min |
| Canadian County | 168,985 | $88K | $246K | 75% | 32% | 94% | 27 min |
| Carter County | 48,555 | $61K | $169K | 67% | 20% | 83% | 22 min |
| Cherokee County | 47,942 | $53K | $169K | 66% | 29% | 83% | 26 min |
| Choctaw County | 14,297 | $44K | $127K | 66% | 15% | 77% | 25 min |
| Cimarron County | 2,218 | $62K | $99K | 78% | 33% | 80% | 9 min |
| Cleveland County | 300,047 | $77K | $236K | 64% | 36% | 93% | 26 min |
| Coal County | 5,320 | $50K | $116K | 69% | 18% | 84% | 22 min |
| Comanche County | 121,825 | $61K | $164K | 56% | 24% | 90% | 20 min |
| Cotton County | 5,485 | $58K | $114K | 80% | 23% | 85% | 29 min |
| Craig County | 14,302 | $52K | $151K | 74% | 15% | 73% | 25 min |
| Creek County | 72,830 | $62K | $182K | 74% | 19% | 88% | 27 min |
| Custer County | 28,259 | $60K | $182K | 60% | 32% | 91% | 20 min |
| Delaware County | 41,279 | $57K | $175K | 77% | 20% | 86% | 30 min |
| Dewey County | 4,360 | $63K | $134K | 76% | 22% | 86% | 22 min |
| Ellis County | 3,683 | $61K | $119K | 82% | 21% | 87% | 23 min |
| Garfield County | 62,146 | $66K | $160K | 66% | 23% | 87% | 19 min |
| Garvin County | 25,860 | $59K | $148K | 68% | 18% | 87% | 26 min |
| Grady County | 56,606 | $75K | $206K | 75% | 23% | 87% | 28 min |
| Grant County | 4,131 | $61K | $106K | 76% | 23% | 77% | 27 min |
| Greer County | 5,489 | $59K | $109K | 78% | 14% | 82% | 17 min |
| Harmon County | 2,406 | $43K | $80K | 70% | 13% | 85% | 19 min |
| Harper County | 3,203 | $64K | $99K | 84% | 29% | 85% | 21 min |
| Haskell County | 11,683 | $50K | $139K | 78% | 16% | 83% | 28 min |
| Hughes County | 13,389 | $52K | $102K | 74% | 16% | 81% | 27 min |
| Jackson County | 24,678 | $63K | $158K | 59% | 25% | 90% | 14 min |
| Jefferson County | 5,380 | $49K | $83K | 71% | 16% | 74% | 28 min |
| Johnston County | 10,278 | $53K | $117K | 72% | 21% | 80% | 26 min |
| Kay County | 43,625 | $58K | $125K | 69% | 19% | 84% | 20 min |
| Kingfisher County | 15,430 | $72K | $216K | 75% | 24% | 91% | 24 min |
| Kiowa County | 8,383 | $45K | $96K | 70% | 17% | 87% | 24 min |
| Latimer County | 9,518 | $41K | $108K | 72% | 11% | 80% | 25 min |
| Le Flore County | 49,053 | $52K | $136K | 73% | 15% | 81% | 26 min |
| Lincoln County | 34,219 | $62K | $167K | 80% | 16% | 82% | 32 min |
| Logan County | 51,938 | $84K | $247K | 85% | 31% | 91% | 31 min |
| Love County | 10,261 | $67K | $171K | 73% | 17% | 84% | 25 min |
| Major County | 7,628 | $71K | $150K | 83% | 20% | 90% | 26 min |
| Marshall County | 15,792 | $57K | $165K | 78% | 18% | 84% | 27 min |
| Mayes County | 39,604 | $60K | $188K | 74% | 18% | 88% | 28 min |
| McClain County | 45,273 | $85K | $256K | 79% | 29% | 92% | 30 min |
| McCurtain County | 30,863 | $52K | $145K | 73% | 16% | 82% | 25 min |
| McIntosh County | 19,400 | $46K | $146K | 77% | 16% | 78% | 29 min |
| Murray County | 13,753 | $66K | $160K | 72% | 20% | 78% | 23 min |
| Muskogee County | 66,444 | $54K | $153K | 67% | 19% | 79% | 24 min |
| Noble County | 10,897 | $66K | $146K | 78% | 18% | 83% | 21 min |
| Nowata County | 9,435 | $54K | $138K | 74% | 17% | 73% | 31 min |
| Okfuskee County | 11,278 | $48K | $116K | 69% | 14% | 82% | 27 min |
| Oklahoma County | 806,199 | $67K | $223K | 58% | 36% | 92% | 23 min |
| Okmulgee County | 36,899 | $54K | $121K | 70% | 18% | 84% | 27 min |
| Osage County | 45,997 | $63K | $182K | 78% | 23% | 89% | 27 min |
| Ottawa County | 30,341 | $50K | $123K | 68% | 15% | 83% | 22 min |
| Pawnee County | 15,795 | $59K | $132K | 80% | 17% | 82% | 30 min |
| Payne County | 82,972 | $50K | $223K | 51% | 40% | 87% | 20 min |
| Pittsburg County | 43,561 | $55K | $157K | 71% | 20% | 88% | 23 min |
| Pontotoc County | 38,235 | $63K | $175K | 66% | 30% | 87% | 19 min |
| Pottawatomie County | 73,463 | $61K | $165K | 70% | 20% | 87% | 26 min |
| Pushmataha County | 10,790 | $48K | $132K | 75% | 16% | 73% | 26 min |
| Roger Mills County | 3,359 | $66K | $158K | 83% | 25% | 89% | 27 min |
| Rogers County | 98,610 | $80K | $241K | 78% | 27% | 91% | 28 min |
| Seminole County | 23,494 | $48K | $100K | 71% | 16% | 81% | 26 min |
| Sequoyah County | 39,860 | $51K | $139K | 71% | 15% | 83% | 27 min |
| Stephens County | 43,551 | $62K | $145K | 74% | 21% | 86% | 24 min |
| Texas County | 20,774 | $60K | $164K | 66% | 22% | 87% | 18 min |
| Tillman County | 6,910 | $49K | $80K | 73% | 17% | 75% | 26 min |
| Tulsa County | 680,794 | $69K | $230K | 60% | 34% | 91% | 22 min |
| Wagoner County | 86,609 | $81K | $235K | 81% | 28% | 93% | 28 min |
| Washington County | 53,326 | $60K | $173K | 72% | 30% | 87% | 22 min |
| Washita County | 10,815 | $64K | $118K | 76% | 20% | 84% | 24 min |
| Woods County | 8,596 | $53K | $140K | 65% | 33% | 84% | 16 min |
| Woodward County | 20,158 | $61K | $169K | 73% | 21% | 90% | 22 min |
Source: U.S. Census Bureau, American Community Survey 2020–2024 5-year estimates
People.
4,028,634 residents in 1,562,389 households, next to the United States figure.
Source: U.S. Census Bureau, American Community Survey 2020–2024 5-year estimates
Homes.
1,775,127 housing units; the median owner-occupied home is valued at $199,800 (±$1,121).
When homes were built
Source: U.S. Census Bureau, American Community Survey 2020–2024 5-year estimates
Income and work.
Household income and work, in 2024 dollars; median household income ±$439.
The poverty rate uses the federal poverty thresholds, which vary with family size. It says nothing on its own about what a neighborhood is like to live in.
Source: U.S. Census Bureau, American Community Survey 2020–2024 5-year estimates
Getting around.
How workers aged 16 and over get to work, and how long it takes.
Source: U.S. Census Bureau, American Community Survey 2020–2024 5-year estimates
Internet.
Home internet subscriptions.
American Community Survey figures are estimates from a rolling sample, averaged over 2020–2024. Each comes with a margin of error, which is wider in places with fewer people.
Source: U.S. Census Bureau, American Community Survey 2020–2024 5-year estimates
Counties in Oklahoma.
Every county has its own page, with all of its ZIP codes.