Providence County
Providence County has 664,854 residents across 40 ZIP codes with their own report. Median household income is $78,787, 10% below the Rhode Island figure. The typical owner-occupied home is valued at $373,600, and 32% of adults 25 and over hold a bachelor’s degree or higher.

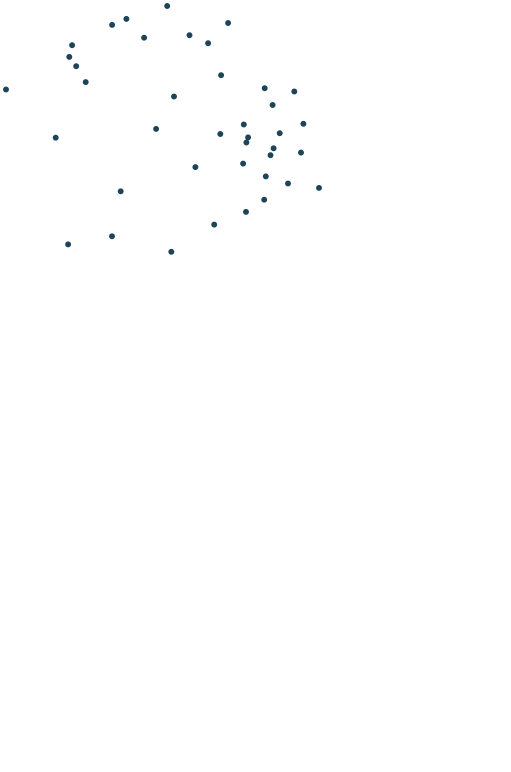
Sources: U.S. Census Bureau, American Community Survey 2020–2024 5-year estimates · U.S. Census Bureau, 2024 Gazetteer and 2020 ZCTA relationship files
All 40 ZIP codes.
Colour shows where each zip code sits among the others in the table, from lowest to highest.
| ZIP code | Residents | Household income | Home value | Owners | Bachelor's+ | Broadband | Commute |
|---|---|---|---|---|---|---|---|
| 02802 | 677 | $116K | $363K | 83% | 30% | 100% | 34 min |
| 02814 | 7,587 | $111K | $391K | 92% | 36% | 92% | 40 min |
| 02815 | 161 | $126K | $421K | 100% | 0% | 100% | – |
| 02824 | 448 | $204K | $413K | 100% | 55% | 100% | 27 min |
| 02825 | 6,107 | $113K | $446K | 92% | 37% | 92% | 36 min |
| 02826 | 831 | $79K | $286K | 79% | 9% | 100% | 32 min |
| 02828 | 7,023 | $97K | $441K | 86% | 43% | 90% | 27 min |
| 02830 | 6,637 | $121K | $409K | 83% | 27% | 89% | 37 min |
| 02831 | 3,483 | $137K | $462K | 95% | 31% | 91% | 31 min |
| 02838 | 3,740 | $97K | $372K | 65% | 41% | 92% | 28 min |
| 02839 | 1,525 | $97K | $338K | 94% | 31% | 96% | 41 min |
| 02857 | 8,262 | $109K | $428K | 83% | 37% | 92% | 33 min |
| 02858 | 738 | $129K | $352K | 46% | 19% | 100% | 45 min |
| 02859 | 7,018 | $125K | $386K | 81% | 24% | 97% | 38 min |
| 02860 | 47,818 | $62K | $336K | 41% | 23% | 88% | 28 min |
| 02861 | 28,124 | $83K | $315K | 67% | 21% | 92% | 28 min |
| 02863 | 22,701 | $49K | $352K | 26% | 11% | 87% | 30 min |
| 02864 | 36,820 | $118K | $431K | 76% | 45% | 93% | 28 min |
| 02865 | 18,447 | $106K | $470K | 73% | 48% | 91% | 26 min |
| 02876 | 355 | $-666667K | $-666667K | 0% | 19% | 86% | 19 min |
| 02895 | 43,521 | $61K | $311K | 37% | 20% | 90% | 31 min |
| 02896 | 11,583 | $109K | $457K | 82% | 34% | 94% | 30 min |
| 02903 | 11,836 | $64K | $409K | 25% | 56% | 82% | 24 min |
| 02904 | 32,531 | $67K | $340K | 52% | 32% | 88% | 29 min |
| 02905 | 25,012 | $63K | $372K | 50% | 30% | 83% | 33 min |
| 02906 | 26,380 | $103K | $639K | 52% | 80% | 96% | 26 min |
| 02907 | 31,461 | $52K | $349K | 36% | 23% | 89% | 25 min |
| 02908 | 39,500 | $73K | $324K | 46% | 27% | 91% | 27 min |
| 02909 | 46,014 | $65K | $325K | 40% | 22% | 91% | 30 min |
| 02910 | 23,499 | $91K | $339K | 69% | 30% | 97% | 26 min |
| 02911 | 15,653 | $89K | $360K | 68% | 38% | 89% | 28 min |
| 02912 | 4,836 | $-666667K | $-666667K | 0% | 0% | 58% | 13 min |
| 02914 | 21,834 | $61K | $359K | 51% | 26% | 88% | 22 min |
| 02915 | 16,752 | $84K | $358K | 65% | 32% | 93% | 27 min |
| 02916 | 8,695 | $95K | $404K | 71% | 44% | 90% | 28 min |
| 02917 | 15,293 | $111K | $452K | 79% | 39% | 93% | 27 min |
| 02918 | 2,925 | $-666667K | $-666667K | 0% | 15% | 100% | 14 min |
| 02919 | 29,802 | $92K | $356K | 76% | 29% | 94% | 26 min |
| 02920 | 37,155 | $81K | $370K | 64% | 32% | 88% | 24 min |
| 02921 | 12,149 | $147K | $536K | 85% | 53% | 98% | 27 min |
Source: U.S. Census Bureau, American Community Survey 2020–2024 5-year estimates
People.
664,854 residents in 259,210 households, next to the Rhode Island figure.
Source: U.S. Census Bureau, American Community Survey 2020–2024 5-year estimates
Homes.
277,740 housing units; the median owner-occupied home is valued at $373,600 (±$3,437).
When homes were built
Source: U.S. Census Bureau, American Community Survey 2020–2024 5-year estimates
Income and work.
Household income and work, in 2024 dollars; median household income ±$1,722.
The poverty rate uses the federal poverty thresholds, which vary with family size. It says nothing on its own about what a neighborhood is like to live in.
Source: U.S. Census Bureau, American Community Survey 2020–2024 5-year estimates
Getting around.
How workers aged 16 and over get to work, and how long it takes.
Source: U.S. Census Bureau, American Community Survey 2020–2024 5-year estimates
Internet.
Home internet subscriptions.
American Community Survey figures are estimates from a rolling sample, averaged over 2020–2024. Each comes with a margin of error, which is wider in places with fewer people.
Source: U.S. Census Bureau, American Community Survey 2020–2024 5-year estimates
Around here.
Photographs taken near Providence County, Rhode Island, shared on Wikimedia Commons under free licences.

i
Photo: author named on the file page · Public domain
View on Wikimedia Commons


i


