South Carolina
South Carolina has 5,296,225 residents in 46 counties and 411 ZIP codes. The median household income is $69,324, 14% below the national figure, and the typical owner-occupied home is valued at $259,000. 72% of households own their home.
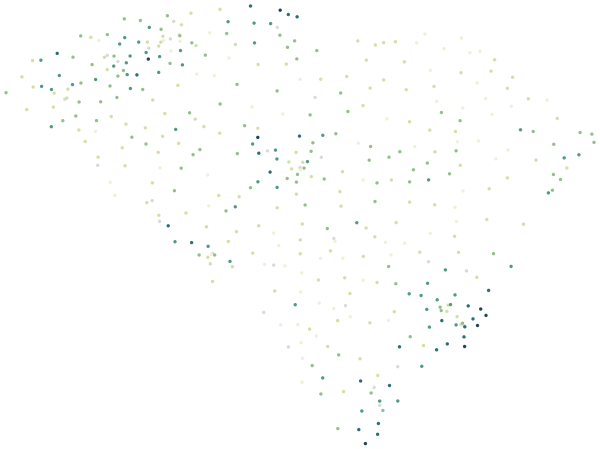
Sources: U.S. Census Bureau, American Community Survey 2020–2024 5-year estimates · U.S. Census Bureau, 2024 Gazetteer and 2020 ZCTA relationship files
All 46 counties.
Colour shows where each county sits among the others in the table, from lowest to highest.
| County | Residents | Household income | Home value | Owners | Bachelor's+ | Broadband | Commute |
|---|---|---|---|---|---|---|---|
| Abbeville County | 24,420 | $53K | $179K | 78% | 20% | 82% | 27 min |
| Aiken County | 174,160 | $71K | $218K | 77% | 32% | 91% | 27 min |
| Allendale County | 7,661 | $32K | $76K | 62% | 14% | 74% | 38 min |
| Anderson County | 210,478 | $67K | $232K | 75% | 27% | 89% | 28 min |
| Bamberg County | 13,042 | $44K | $98K | 70% | 18% | 79% | 31 min |
| Barnwell County | 20,521 | $47K | $106K | 71% | 14% | 75% | 30 min |
| Beaufort County | 195,289 | $87K | $456K | 76% | 46% | 94% | 25 min |
| Berkeley County | 246,802 | $84K | $310K | 75% | 31% | 90% | 32 min |
| Calhoun County | 14,182 | $59K | $172K | 85% | 25% | 81% | 29 min |
| Charleston County | 420,264 | $88K | $489K | 64% | 50% | 89% | 27 min |
| Cherokee County | 56,647 | $50K | $142K | 74% | 18% | 81% | 27 min |
| Chester County | 32,182 | $52K | $158K | 78% | 14% | 83% | 33 min |
| Chesterfield County | 43,784 | $49K | $116K | 73% | 14% | 83% | 27 min |
| Clarendon County | 30,986 | $52K | $158K | 73% | 18% | 86% | 33 min |
| Colleton County | 38,783 | $51K | $163K | 73% | 17% | 85% | 38 min |
| Darlington County | 62,558 | $49K | $158K | 71% | 20% | 78% | 24 min |
| Dillon County | 27,862 | $47K | $85K | 65% | 14% | 70% | 28 min |
| Dorchester County | 167,201 | $78K | $329K | 76% | 30% | 92% | 34 min |
| Edgefield County | 27,476 | $73K | $203K | 80% | 23% | 80% | 28 min |
| Fairfield County | 20,550 | $48K | $151K | 75% | 15% | 82% | 32 min |
| Florence County | 137,117 | $58K | $178K | 65% | 24% | 83% | 24 min |
| Georgetown County | 64,811 | $69K | $290K | 84% | 33% | 87% | 31 min |
| Greenville County | 548,166 | $77K | $299K | 69% | 41% | 92% | 25 min |
| Greenwood County | 69,489 | $53K | $181K | 67% | 25% | 85% | 22 min |
| Hampton County | 18,254 | $45K | $112K | 73% | 12% | 83% | 37 min |
| Horry County | 383,016 | $67K | $288K | 77% | 27% | 93% | 25 min |
| Jasper County | 32,166 | $66K | $326K | 77% | 26% | 86% | 32 min |
| Kershaw County | 68,314 | $68K | $217K | 82% | 24% | 90% | 32 min |
| Lancaster County | 104,475 | $79K | $330K | 83% | 34% | 89% | 32 min |
| Laurens County | 68,666 | $58K | $171K | 72% | 18% | 86% | 27 min |
| Lee County | 16,166 | $45K | $105K | 71% | 12% | 85% | 31 min |
| Lexington County | 304,887 | $77K | $235K | 77% | 34% | 92% | 28 min |
| Marion County | 28,664 | $36K | $93K | 63% | 15% | 69% | 31 min |
| Marlboro County | 25,975 | $34K | $82K | 63% | 9% | 71% | 29 min |
| McCormick County | 9,760 | $56K | $169K | 88% | 24% | 83% | 36 min |
| Newberry County | 38,435 | $62K | $173K | 73% | 23% | 85% | 29 min |
| Oconee County | 80,469 | $62K | $237K | 76% | 29% | 85% | 26 min |
| Orangeburg County | 83,253 | $46K | $116K | 67% | 19% | 80% | 33 min |
| Pickens County | 134,629 | $61K | $232K | 71% | 29% | 87% | 28 min |
| Richland County | 422,117 | $64K | $243K | 60% | 41% | 90% | 25 min |
| Saluda County | 19,131 | $51K | $147K | 79% | 20% | 78% | 31 min |
| Spartanburg County | 347,852 | $66K | $233K | 73% | 25% | 89% | 27 min |
| Sumter County | 104,725 | $57K | $165K | 68% | 24% | 87% | 25 min |
| Union County | 26,885 | $42K | $104K | 71% | 15% | 82% | 30 min |
| Williamsburg County | 30,282 | $46K | $105K | 76% | 17% | 77% | 34 min |
| York County | 293,673 | $89K | $361K | 75% | 39% | 93% | 30 min |
Source: U.S. Census Bureau, American Community Survey 2020–2024 5-year estimates
People.
5,296,225 residents in 2,117,989 households, next to the United States figure.
Source: U.S. Census Bureau, American Community Survey 2020–2024 5-year estimates
Homes.
2,443,039 housing units; the median owner-occupied home is valued at $259,000 (±$1,421).
When homes were built
Source: U.S. Census Bureau, American Community Survey 2020–2024 5-year estimates
Income and work.
Household income and work, in 2024 dollars; median household income ±$570.
The poverty rate uses the federal poverty thresholds, which vary with family size. It says nothing on its own about what a neighborhood is like to live in.
Source: U.S. Census Bureau, American Community Survey 2020–2024 5-year estimates
Getting around.
How workers aged 16 and over get to work, and how long it takes.
Source: U.S. Census Bureau, American Community Survey 2020–2024 5-year estimates
Internet.
Home internet subscriptions.
American Community Survey figures are estimates from a rolling sample, averaged over 2020–2024. Each comes with a margin of error, which is wider in places with fewer people.
Source: U.S. Census Bureau, American Community Survey 2020–2024 5-year estimates
Counties in South Carolina.
Every county has its own page, with all of its ZIP codes.