South Dakota
South Dakota has 907,428 residents in 66 counties and 347 ZIP codes. The median household income is $75,081, 7% below the national figure, and the typical owner-occupied home is valued at $257,400. 69% of households own their home.
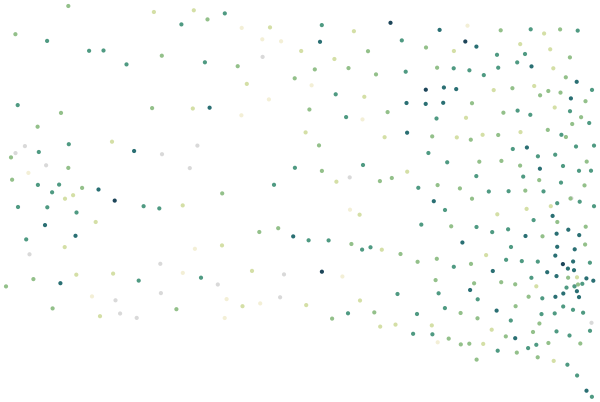
Sources: U.S. Census Bureau, American Community Survey 2020–2024 5-year estimates · U.S. Census Bureau, 2024 Gazetteer and 2020 ZCTA relationship files
All 66 counties.
Colour shows where each county sits among the others in the table, from lowest to highest.
| County | Residents | Household income | Home value | Owners | Bachelor's+ | Broadband | Commute |
|---|---|---|---|---|---|---|---|
| Aurora County | 2,642 | $73K | $152K | 73% | 21% | 84% | 22 min |
| Beadle County | 19,309 | $68K | $175K | 73% | 27% | 89% | 15 min |
| Bennett County | 3,345 | $54K | $156K | 61% | 18% | 65% | 14 min |
| Bon Homme County | 7,044 | $64K | $134K | 81% | 20% | 85% | 21 min |
| Brookings County | 35,353 | $70K | $265K | 57% | 43% | 91% | 16 min |
| Brown County | 37,877 | $71K | $221K | 68% | 34% | 88% | 15 min |
| Brule County | 5,283 | $74K | $217K | 76% | 29% | 81% | 17 min |
| Buffalo County | 1,808 | $47K | $118K | 53% | 10% | 69% | 15 min |
| Butte County | 10,676 | $76K | $245K | 76% | 20% | 90% | 25 min |
| Campbell County | 1,593 | $69K | $116K | 76% | 36% | 83% | 16 min |
| Charles Mix County | 9,281 | $64K | $171K | 72% | 26% | 83% | 16 min |
| Clark County | 3,917 | $71K | $158K | 78% | 20% | 86% | 22 min |
| Clay County | 15,219 | $57K | $232K | 51% | 45% | 91% | 20 min |
| Codington County | 28,767 | $73K | $238K | 70% | 21% | 88% | 15 min |
| Corson County | 3,806 | $46K | $70K | 59% | 19% | 85% | 23 min |
| Custer County | 8,892 | $84K | $372K | 86% | 32% | 88% | 30 min |
| Davison County | 19,952 | $66K | $206K | 62% | 23% | 86% | 16 min |
| Day County | 5,437 | $66K | $174K | 75% | 22% | 84% | 23 min |
| Deuel County | 4,328 | $83K | $206K | 83% | 25% | 85% | 25 min |
| Dewey County | 5,205 | $54K | $70K | 61% | 19% | 85% | 20 min |
| Douglas County | 2,828 | $86K | $167K | 77% | 25% | 87% | 20 min |
| Edmunds County | 4,048 | $82K | $163K | 81% | 28% | 93% | 21 min |
| Fall River County | 7,258 | $68K | $193K | 72% | 29% | 86% | 19 min |
| Faulk County | 2,126 | $58K | $148K | 80% | 23% | 81% | 19 min |
| Grant County | 7,563 | $75K | $171K | 76% | 25% | 84% | 15 min |
| Gregory County | 4,016 | $63K | $140K | 77% | 22% | 82% | 17 min |
| Haakon County | 1,722 | $66K | $164K | 79% | 22% | 79% | 21 min |
| Hamlin County | 6,373 | $87K | $209K | 82% | 25% | 90% | 23 min |
| Hand County | 3,140 | $75K | $159K | 66% | 28% | 86% | 15 min |
| Hanson County | 3,472 | $81K | $191K | 89% | 23% | 93% | 23 min |
| Harding County | 1,148 | $80K | $166K | 77% | 30% | 94% | 20 min |
| Hughes County | 17,664 | $81K | $242K | 72% | 39% | 93% | 16 min |
| Hutchinson County | 7,404 | $74K | $163K | 77% | 29% | 87% | 19 min |
| Hyde County | 1,191 | $73K | $182K | 84% | 20% | 90% | 17 min |
| Jackson County | 2,802 | $35K | $117K | 67% | 12% | 63% | 13 min |
| Jerauld County | 1,772 | $74K | $151K | 84% | 21% | 86% | 17 min |
| Jones County | 1,004 | $65K | $140K | 76% | 27% | 89% | 17 min |
| Kingsbury County | 5,244 | $74K | $170K | 82% | 23% | 90% | 22 min |
| Lake County | 10,972 | $77K | $248K | 74% | 35% | 87% | 17 min |
| Lawrence County | 27,233 | $73K | $347K | 65% | 33% | 90% | 21 min |
| Lincoln County | 70,638 | $99K | $348K | 71% | 44% | 96% | 21 min |
| Lyman County | 3,724 | $67K | $166K | 70% | 25% | 82% | 18 min |
| Marshall County | 4,344 | $78K | $157K | 80% | 25% | 90% | 18 min |
| McCook County | 5,751 | $84K | $230K | 80% | 30% | 90% | 27 min |
| McPherson County | 2,145 | $67K | $86K | 81% | 27% | 80% | 20 min |
| Meade County | 30,546 | $75K | $311K | 73% | 28% | 93% | 22 min |
| Mellette County | 1,943 | $54K | $84K | 60% | 19% | 74% | 18 min |
| Miner County | 2,300 | $76K | $143K | 85% | 17% | 83% | 24 min |
| Minnehaha County | 203,289 | $77K | $288K | 63% | 35% | 93% | 19 min |
| Moody County | 6,397 | $78K | $227K | 74% | 30% | 88% | 21 min |
| Oglala Lakota County | 13,491 | $41K | $53K | 52% | 12% | 70% | 15 min |
| Pennington County | 113,512 | $75K | $302K | 69% | 35% | 91% | 21 min |
| Perkins County | 3,001 | $67K | $115K | 78% | 25% | 89% | 15 min |
| Potter County | 2,388 | $72K | $121K | 82% | 27% | 88% | 16 min |
| Roberts County | 10,221 | $65K | $155K | 71% | 19% | 83% | 18 min |
| Sanborn County | 2,384 | $79K | $136K | 79% | 21% | 81% | 22 min |
| Spink County | 6,219 | $70K | $123K | 73% | 28% | 88% | 18 min |
| Stanley County | 3,015 | $88K | $204K | 83% | 28% | 91% | 19 min |
| Sully County | 1,526 | $73K | $205K | 73% | 24% | 80% | 20 min |
| Todd County | 9,244 | $42K | $54K | 46% | 17% | 75% | 18 min |
| Tripp County | 5,611 | $59K | $133K | 68% | 18% | 85% | 15 min |
| Turner County | 8,882 | $76K | $223K | 79% | 27% | 88% | 27 min |
| Union County | 17,081 | $90K | $301K | 73% | 37% | 90% | 20 min |
| Walworth County | 5,271 | $65K | $137K | 76% | 30% | 90% | 18 min |
| Yankton County | 23,414 | $73K | $226K | 73% | 31% | 86% | 16 min |
| Ziebach County | 2,377 | $54K | $100K | 57% | 15% | 83% | 23 min |
Source: U.S. Census Bureau, American Community Survey 2020–2024 5-year estimates
People.
907,428 residents in 365,544 households, next to the United States figure.
Source: U.S. Census Bureau, American Community Survey 2020–2024 5-year estimates
Homes.
408,584 housing units; the median owner-occupied home is valued at $257,400 (±$3,051).
When homes were built
Source: U.S. Census Bureau, American Community Survey 2020–2024 5-year estimates
Income and work.
Household income and work, in 2024 dollars; median household income ±$888.
The poverty rate uses the federal poverty thresholds, which vary with family size. It says nothing on its own about what a neighborhood is like to live in.
Source: U.S. Census Bureau, American Community Survey 2020–2024 5-year estimates
Getting around.
How workers aged 16 and over get to work, and how long it takes.
Source: U.S. Census Bureau, American Community Survey 2020–2024 5-year estimates
Internet.
Home internet subscriptions.
American Community Survey figures are estimates from a rolling sample, averaged over 2020–2024. Each comes with a margin of error, which is wider in places with fewer people.
Source: U.S. Census Bureau, American Community Survey 2020–2024 5-year estimates
Counties in South Dakota.
Every county has its own page, with all of its ZIP codes.