Washington
Washington has 7,816,116 residents in 39 counties and 571 ZIP codes. The median household income is $98,141, 22% above the national figure, and the typical owner-occupied home is valued at $564,600. 64% of households own their home.
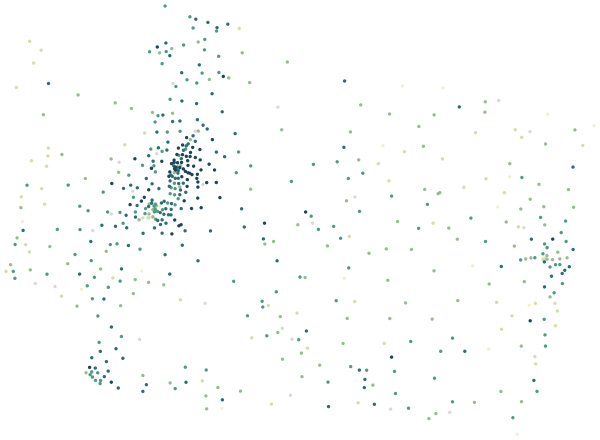
Sources: U.S. Census Bureau, American Community Survey 2020–2024 5-year estimates · U.S. Census Bureau, 2024 Gazetteer and 2020 ZCTA relationship files
All 39 counties.
Colour shows where each county sits among the others in the table, from lowest to highest.
| County | Residents | Household income | Home value | Owners | Bachelor's+ | Broadband | Commute |
|---|---|---|---|---|---|---|---|
| Adams County | 20,800 | $66K | $273K | 69% | 16% | 90% | 25 min |
| Asotin County | 22,467 | $72K | $326K | 73% | 25% | 88% | 17 min |
| Benton County | 212,905 | $90K | $408K | 68% | 33% | 92% | 24 min |
| Chelan County | 80,172 | $82K | $490K | 65% | 31% | 91% | 22 min |
| Clallam County | 77,813 | $70K | $422K | 74% | 32% | 93% | 21 min |
| Clark County | 516,959 | $98K | $523K | 66% | 33% | 95% | 26 min |
| Columbia County | 4,014 | $72K | $271K | 78% | 25% | 82% | 26 min |
| Cowlitz County | 112,360 | $77K | $398K | 68% | 18% | 91% | 28 min |
| Douglas County | 44,366 | $80K | $433K | 69% | 22% | 91% | 22 min |
| Ferry County | 7,387 | $56K | $283K | 78% | 15% | 80% | 24 min |
| Franklin County | 98,902 | $87K | $379K | 71% | 21% | 93% | 24 min |
| Garfield County | 2,353 | $65K | $239K | 77% | 32% | 84% | 29 min |
| Grant County | 101,799 | $73K | $300K | 66% | 18% | 91% | 22 min |
| Grays Harbor County | 77,053 | $64K | $314K | 73% | 18% | 90% | 26 min |
| Island County | 86,836 | $91K | $593K | 75% | 37% | 95% | 28 min |
| Jefferson County | 33,577 | $74K | $535K | 79% | 44% | 93% | 23 min |
| King County | 2,287,171 | $125K | $860K | 55% | 57% | 95% | 30 min |
| Kitsap County | 277,881 | $104K | $555K | 70% | 38% | 95% | 30 min |
| Kittitas County | 47,172 | $74K | $497K | 62% | 37% | 91% | 25 min |
| Klickitat County | 23,411 | $71K | $425K | 77% | 31% | 88% | 29 min |
| Lewis County | 85,154 | $75K | $386K | 76% | 22% | 88% | 30 min |
| Lincoln County | 11,489 | $72K | $293K | 80% | 24% | 87% | 29 min |
| Mason County | 67,982 | $83K | $412K | 82% | 22% | 92% | 38 min |
| Okanogan County | 43,425 | $63K | $300K | 72% | 25% | 87% | 20 min |
| Pacific County | 23,994 | $67K | $335K | 82% | 25% | 90% | 24 min |
| Pend Oreille County | 14,050 | $67K | $368K | 81% | 21% | 89% | 33 min |
| Pierce County | 930,319 | $100K | $527K | 65% | 31% | 95% | 34 min |
| San Juan County | 18,478 | $85K | $799K | 78% | 54% | 94% | 17 min |
| Skagit County | 131,328 | $89K | $545K | 70% | 30% | 94% | 28 min |
| Skamania County | 12,402 | $93K | $530K | 80% | 30% | 89% | 34 min |
| Snohomish County | 844,430 | $111K | $696K | 68% | 38% | 94% | 33 min |
| Spokane County | 549,056 | $79K | $411K | 65% | 33% | 92% | 24 min |
| Stevens County | 48,067 | $69K | $351K | 80% | 22% | 87% | 30 min |
| Thurston County | 299,067 | $97K | $480K | 68% | 39% | 95% | 28 min |
| Wahkiakum County | 4,658 | $63K | $397K | 83% | 22% | 85% | 32 min |
| Walla Walla County | 62,161 | $74K | $409K | 65% | 30% | 89% | 17 min |
| Whatcom County | 230,503 | $82K | $586K | 64% | 39% | 94% | 23 min |
| Whitman County | 47,003 | $55K | $360K | 47% | 50% | 85% | 18 min |
| Yakima County | 257,152 | $71K | $310K | 62% | 19% | 90% | 22 min |
Source: U.S. Census Bureau, American Community Survey 2020–2024 5-year estimates
People.
7,816,116 residents in 3,064,820 households, next to the United States figure.
Source: U.S. Census Bureau, American Community Survey 2020–2024 5-year estimates
Homes.
3,306,620 housing units; the median owner-occupied home is valued at $564,600 (±$1,940).
When homes were built
Source: U.S. Census Bureau, American Community Survey 2020–2024 5-year estimates
Income and work.
Household income and work, in 2024 dollars; median household income ±$414.
The poverty rate uses the federal poverty thresholds, which vary with family size. It says nothing on its own about what a neighborhood is like to live in.
Source: U.S. Census Bureau, American Community Survey 2020–2024 5-year estimates
Getting around.
How workers aged 16 and over get to work, and how long it takes.
Source: U.S. Census Bureau, American Community Survey 2020–2024 5-year estimates
Internet.
Home internet subscriptions.
American Community Survey figures are estimates from a rolling sample, averaged over 2020–2024. Each comes with a margin of error, which is wider in places with fewer people.
Source: U.S. Census Bureau, American Community Survey 2020–2024 5-year estimates
Counties in Washington.
Every county has its own page, with all of its ZIP codes.