West Virginia
West Virginia has 1,778,373 residents in 55 counties and 663 ZIP codes. The median household income is $59,608, 26% below the national figure, and the typical owner-occupied home is valued at $162,600. 75% of households own their home.
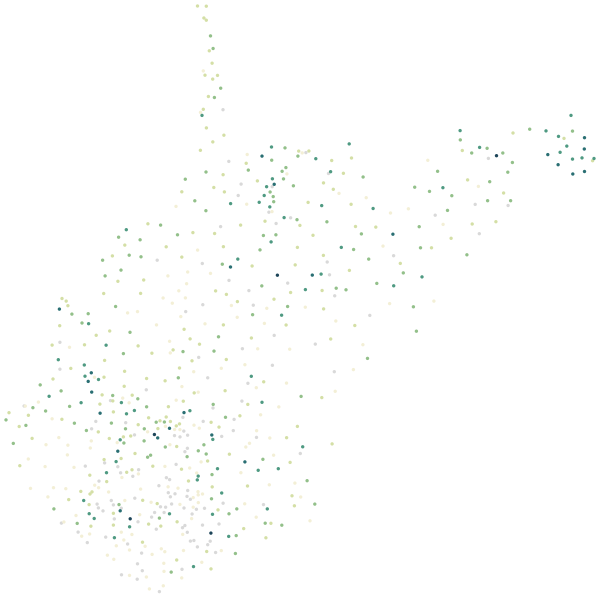
Sources: U.S. Census Bureau, American Community Survey 2020–2024 5-year estimates · U.S. Census Bureau, 2024 Gazetteer and 2020 ZCTA relationship files
All 55 counties.
Colour shows where each county sits among the others in the table, from lowest to highest.
| County | Residents | Household income | Home value | Owners | Bachelor's+ | Broadband | Commute |
|---|---|---|---|---|---|---|---|
| Barbour County | 15,424 | $51K | $132K | 78% | 13% | 84% | 33 min |
| Berkeley County | 129,514 | $81K | $266K | 76% | 25% | 92% | 33 min |
| Boone County | 21,026 | $57K | $93K | 81% | 12% | 87% | 35 min |
| Braxton County | 12,208 | $50K | $118K | 77% | 14% | 80% | 36 min |
| Brooke County | 21,805 | $54K | $142K | 75% | 23% | 83% | 27 min |
| Cabell County | 92,739 | $56K | $164K | 64% | 33% | 87% | 23 min |
| Calhoun County | 6,048 | $44K | $101K | 87% | 10% | 77% | 39 min |
| Clay County | 7,835 | $42K | $109K | 76% | 11% | 84% | 43 min |
| Doddridge County | 7,711 | $57K | $161K | 89% | 14% | 84% | 33 min |
| Fayette County | 39,519 | $53K | $106K | 78% | 16% | 83% | 31 min |
| Gilmer County | 7,288 | $48K | $84K | 76% | 19% | 76% | 35 min |
| Grant County | 10,983 | $62K | $175K | 81% | 14% | 84% | 26 min |
| Greenbrier County | 32,386 | $48K | $149K | 73% | 22% | 84% | 27 min |
| Hampshire County | 23,465 | $63K | $219K | 83% | 18% | 83% | 43 min |
| Hancock County | 28,431 | $61K | $131K | 75% | 20% | 88% | 27 min |
| Hardy County | 14,243 | $49K | $166K | 77% | 16% | 84% | 31 min |
| Harrison County | 64,984 | $60K | $166K | 74% | 27% | 86% | 24 min |
| Jackson County | 27,705 | $59K | $157K | 79% | 20% | 77% | 31 min |
| Jefferson County | 59,260 | $99K | $351K | 80% | 34% | 92% | 40 min |
| Kanawha County | 176,537 | $61K | $147K | 71% | 30% | 88% | 23 min |
| Lewis County | 16,740 | $56K | $152K | 72% | 19% | 84% | 30 min |
| Lincoln County | 19,902 | $46K | $105K | 75% | 8% | 85% | 35 min |
| Logan County | 31,418 | $50K | $103K | 77% | 15% | 90% | 31 min |
| Marion County | 55,909 | $67K | $167K | 77% | 27% | 90% | 28 min |
| Marshall County | 29,865 | $59K | $150K | 78% | 21% | 86% | 27 min |
| Mason County | 25,043 | $50K | $120K | 82% | 16% | 85% | 29 min |
| McDowell County | 17,943 | $32K | $50K | 77% | 7% | 86% | 39 min |
| Mercer County | 58,563 | $53K | $122K | 73% | 23% | 87% | 26 min |
| Mineral County | 26,854 | $69K | $180K | 81% | 24% | 89% | 28 min |
| Mingo County | 22,542 | $38K | $91K | 73% | 10% | 86% | 36 min |
| Monongalia County | 107,163 | $65K | $268K | 58% | 49% | 90% | 23 min |
| Monroe County | 12,386 | $57K | $156K | 87% | 15% | 81% | 41 min |
| Morgan County | 17,426 | $72K | $241K | 84% | 18% | 85% | 41 min |
| Nicholas County | 24,277 | $55K | $122K | 82% | 23% | 83% | 33 min |
| Ohio County | 41,582 | $57K | $166K | 66% | 34% | 87% | 23 min |
| Pendleton County | 6,043 | $65K | $184K | 85% | 19% | 79% | 32 min |
| Pleasants County | 7,521 | $61K | $151K | 81% | 14% | 91% | 30 min |
| Pocahontas County | 7,784 | $42K | $152K | 84% | 20% | 75% | 24 min |
| Preston County | 34,160 | $62K | $163K | 82% | 18% | 86% | 34 min |
| Putnam County | 57,177 | $80K | $223K | 82% | 29% | 88% | 28 min |
| Raleigh County | 73,195 | $52K | $151K | 75% | 23% | 76% | 26 min |
| Randolph County | 27,576 | $53K | $145K | 75% | 20% | 84% | 23 min |
| Ritchie County | 8,286 | $51K | $116K | 84% | 14% | 81% | 34 min |
| Roane County | 13,786 | $46K | $122K | 79% | 15% | 76% | 35 min |
| Summers County | 11,729 | $41K | $140K | 81% | 19% | 72% | 37 min |
| Taylor County | 16,487 | $58K | $149K | 84% | 21% | 85% | 30 min |
| Tucker County | 6,654 | $53K | $155K | 81% | 24% | 82% | 29 min |
| Tyler County | 8,064 | $64K | $121K | 84% | 16% | 86% | 35 min |
| Upshur County | 23,712 | $54K | $171K | 81% | 18% | 86% | 29 min |
| Wayne County | 38,164 | $59K | $127K | 79% | 19% | 86% | 28 min |
| Webster County | 8,144 | $44K | $76K | 77% | 13% | 81% | 32 min |
| Wetzel County | 14,078 | $57K | $108K | 83% | 17% | 81% | 32 min |
| Wirt County | 5,053 | $50K | $116K | 88% | 16% | 79% | 36 min |
| Wood County | 83,407 | $58K | $159K | 75% | 24% | 87% | 23 min |
| Wyoming County | 20,629 | $48K | $83K | 83% | 13% | 77% | 34 min |
Source: U.S. Census Bureau, American Community Survey 2020–2024 5-year estimates
People.
1,778,373 residents in 728,655 households, next to the United States figure.
Source: U.S. Census Bureau, American Community Survey 2020–2024 5-year estimates
Homes.
861,325 housing units; the median owner-occupied home is valued at $162,600 (±$1,346).
When homes were built
Source: U.S. Census Bureau, American Community Survey 2020–2024 5-year estimates
Income and work.
Household income and work, in 2024 dollars; median household income ±$691.
The poverty rate uses the federal poverty thresholds, which vary with family size. It says nothing on its own about what a neighborhood is like to live in.
Source: U.S. Census Bureau, American Community Survey 2020–2024 5-year estimates
Getting around.
How workers aged 16 and over get to work, and how long it takes.
Source: U.S. Census Bureau, American Community Survey 2020–2024 5-year estimates
Internet.
Home internet subscriptions.
American Community Survey figures are estimates from a rolling sample, averaged over 2020–2024. Each comes with a margin of error, which is wider in places with fewer people.
Source: U.S. Census Bureau, American Community Survey 2020–2024 5-year estimates
Counties in West Virginia.
Every county has its own page, with all of its ZIP codes.