Denmark
Denmark had 6,025,603 residents on 1 January 2026, in 5 regions and 98 municipalities. Average disposable income was DKK 287,682 per person in 2024, and 47% of occupied homes were lived in by their owner. A detached house sold for DKK 3.06m on average in 2025. The population has grown by 5.6% since 2016.
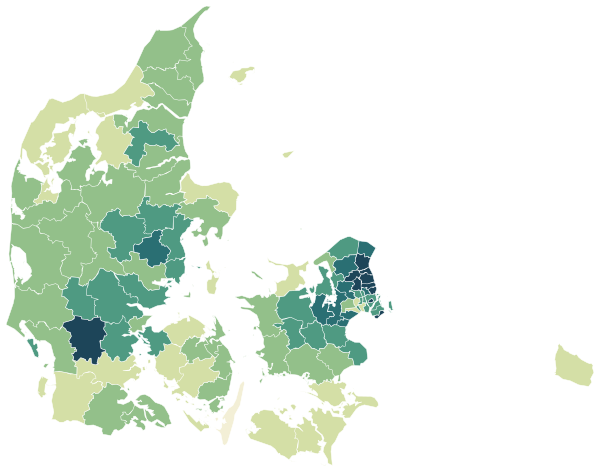
Sources: Own calculations based on figures from Statistics Denmark (StatBank) · © OpenStreetMap contributors (ODbL); municipal and regional boundaries from OpenStreetMap
All 5 regions.
Colour shows where each one sits among the others in the table, from lowest to highest.
| Region | Residents | Income | Owner-occupied | Social housing | 65+ | Unemployment | Per km² | Cars per 1,000 |
|---|---|---|---|---|---|---|---|---|
| Capital Region of Denmark | 1,947,212 | DKK 322,023 | 37% | 23% | 18% | 3.1% | 759 | 420 |
| Region Zealand | 858,102 | DKK 277,603 | 55% | 18% | 24% | 2.6% | 119 | 509 |
| Region of Southern Denmark | 1,243,914 | DKK 269,119 | 51% | 19% | 23% | 2.8% | 101 | 518 |
| Central Denmark Region | 1,383,261 | DKK 275,313 | 50% | 18% | 21% | 2.7% | 106 | 508 |
| North Denmark Region | 593,114 | DKK 261,912 | 52% | 18% | 24% | 3.0% | 75 | 525 |
Sources: Own calculations based on figures from Statistics Denmark (StatBank) · © OpenStreetMap contributors (ODbL); municipal and regional boundaries from OpenStreetMap
People.
Age on 1 January 2026.
Population on 1 January
Source: Own calculations based on figures from Statistics Denmark (StatBank)
Work, income and education.
Work on 1 January 2025 and highest completed education on 1 October 2025, residents aged 15 and over.
Highest completed education
Disposable income is what is left for spending and saving once tax and interest have been paid. The figure is an average for everyone in the area in 2024.
Parish unemployment comes from residents’ socio-economic status on 1 January 2025. The municipal rate is full-time unemployment averaged over 2025. The two are measured differently.
Source: Own calculations based on figures from Statistics Denmark (StatBank)
Homes.
2,872,738 occupied homes in 2026.
Types of home
Year built
Average price of a detached house
The average price covers detached houses sold on the open market during the year and depends on which houses happened to be sold.
Source: Own calculations based on figures from Statistics Denmark (StatBank)
Everyday life.
105 everyday shops and services within a 15-minute walk; 15% green space within 500 metres.
Shops and services are counted within 1.2 km in a straight line from the parish church, green space within 500 metres. Municipal and regional figures are averages weighted by population.
Source: © OpenStreetMap contributors (ODbL); municipal and regional boundaries from OpenStreetMap
Regions.