Lohja
Lohja had 45,687 residents at the end of 2024. Median disposable income of adults was €27,322 in 2024, 6% below the regional level. 29% of households rented and 70% owned their home. The population has fallen by 3.5% since 2015.
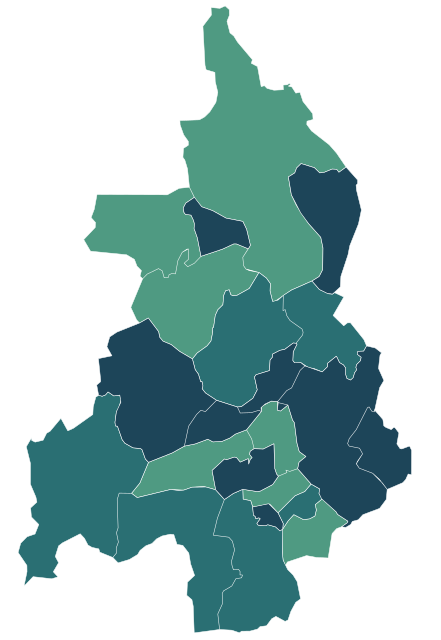
Sources: Statistics Finland, Paavo open data by postal code area 2026 (CC BY 4.0) · Statistics Finland, municipal and regional boundaries 2026 (CC BY 4.0) · © OpenStreetMap contributors (ODbL)
All 20 postcode areas.
Colour shows where each one sits among the others in the table, from lowest to highest.
| Postcode area | Residents | Median income | Renting | Owning | 65+ | Avg. age | Unemployment | Green 500 m | Services 15 min |
|---|---|---|---|---|---|---|---|---|---|
| 03810 Ikkala | 511 | €26,281 | 17% | 81% | 31% | 51 | 11.3% | 34% | 2 |
| 03850 Pusula | 1,540 | €25,912 | 17% | 81% | 31% | 49 | 10.6% | 20% | 10 |
| 03870 Hyönölä | 175 | €28,333 | 6% | 92% | 30% | 49 | 9.1% | 38% | 2 |
| 08100 Lohja Keskus | 8,452 | €26,221 | 41% | 58% | 37% | 52 | 10.8% | 15% | 109 |
| 08150 Keskilohja | 5,253 | €29,532 | 28% | 71% | 19% | 42 | 8.0% | 28% | 35 |
| 08200 Ojamo | 3,880 | €25,582 | 48% | 52% | 27% | 45 | 15.2% | 33% | 44 |
| 08350 Routio | 2,233 | €26,985 | 34% | 65% | 24% | 46 | 14.6% | 20% | 5 |
| 08450 Hormajärvi | 240 | €28,069 | 15% | 81% | 42% | 55 | 10.3% | 59% | 2 |
| 08480 Karstu | 253 | €26,801 | 7% | 93% | 27% | 44 | 5.4% | 90% | 0 |
| 08500 Ventelä-Millola | 6,125 | €29,189 | 21% | 78% | 23% | 44 | 8.6% | 37% | 24 |
| 08680 Muijala | 1,664 | €32,209 | 14% | 85% | 15% | 42 | 8.0% | 55% | 21 |
| 08700 Virkkala | 7,019 | €27,108 | 28% | 71% | 27% | 47 | 11.2% | 23% | 29 |
| 08800 Kirkniemi | 1,454 | €30,347 | 11% | 88% | 22% | 45 | 8.4% | 26% | 11 |
| 09120 Karjalohja | 1,219 | €25,380 | 21% | 76% | 31% | 48 | 13.3% | 27% | 6 |
| 09220 Sammatti | 1,576 | €27,915 | 13% | 85% | 24% | 44 | 10.5% | 46% | 7 |
| 09430 Saukkola | 1,530 | €27,449 | 18% | 81% | 25% | 47 | 10.2% | 28% | 10 |
| 09520 Millola | 114 | €26,026 | 7% | 89% | 38% | 53 | 3.7% | 51% | 0 |
| 09630 Koisjärvi | 473 | €29,510 | 8% | 87% | 22% | 44 | 6.1% | 28% | 2 |
| 09810 Nummi-Oinola | 932 | €26,762 | 17% | 82% | 28% | 48 | 13.7% | 17% | 10 |
| 09930 Leppäkorpi | 263 | €26,423 | 6% | 90% | 32% | 53 | 5.8% | 21% | 0 |
Sources: Statistics Finland, Paavo open data by postal code area 2026 (CC BY 4.0) · © OpenStreetMap contributors (ODbL)
People.
Age at the end of 2024, next to the figure for Uusimaa.
Main activity
Population at the end of each year
Source: Statistics Finland, Paavo open data by postal code area 2026 (CC BY 4.0)
Income and education.
Disposable income in 2024 and education at the end of 2024.
Education of adults
Income is the disposable money income of residents aged 18 and over in 2024: taxable and tax-free income minus taxes and contributions. The median is the middle value, so a few high earners do not pull it up.
Source: Statistics Finland, Paavo open data by postal code area 2026 (CC BY 4.0)
Homes.
22,553 households and 25,016 homes at the end of 2024.
Households by tenure
Households
Household groups overlap: young one-person households, for example, are also counted as one-person households.
Statistics Finland withholds a figure when fewer than 30 people are behind it (fewer than 10 for workplaces). Missing figures are shown as a dash and never estimated.
Source: Statistics Finland, Paavo open data by postal code area 2026 (CC BY 4.0)
Everyday life.
39 everyday shops and services within a 15-minute walk; 28% green space within 500 metres.
Services and green space are measured from each postcode area’s service centre: the point inside the area with the most shops and services within 500 metres. Municipal and regional figures are averages weighted by population.
Source: © OpenStreetMap contributors (ODbL)
Around here.
Photographs taken near Lohja, shared on Wikimedia Commons under free licences.

i


i


i

Postcode areas.
Other municipalities in Uusimaa.