Gothenburg
Gothenburg had 613,278 residents on 31 December 2025. Average net income for residents aged 20 and over was SEK 367,000 in 2024, in line with the county average. A house for permanent living cost SEK 7,154,000 on average in 2025 (1,351 sales). The population has grown by 10% since 2016.
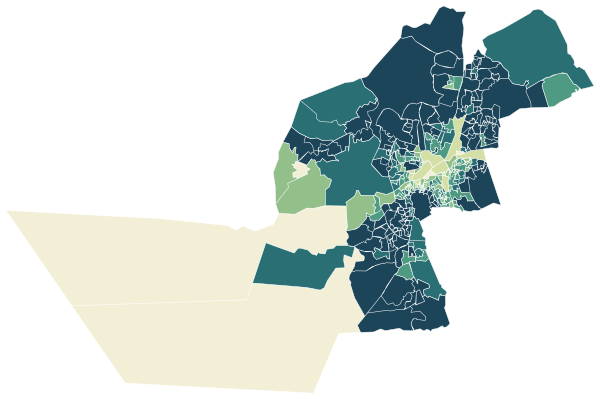
Sources: Statistics Sweden (SCB), Statistical Database (CC0) · Statistics Sweden, DeSO and RegSO 2025 boundaries (CC0) · © OpenStreetMap contributors (ODbL)
All 147 neighbourhood areas.
Colour shows where each one sits among the others in the table, from lowest to highest.
| Area | Residents | Income | Rented | Co-op flats | Owned | 65+ | Employed | Green 500 m | Services 15 min |
|---|---|---|---|---|---|---|---|---|---|
| Angered centrum-Agnesberg | 5,859 | SEK 274,000 | 37% | 52% | 10% | 18% | 70% | 44% | 84 |
| Annedal-Änggården | 5,727 | SEK 415,000 | 61% | 31% | 8% | 24% | 81% | 31% | 619 |
| Askim norra | 7,060 | SEK 388,000 | 56% | 25% | 19% | 16% | 84% | 25% | 98 |
| Askim södra | 6,073 | SEK 478,000 | 26% | 1% | 73% | 19% | 84% | 27% | 91 |
| Backa Röd | 2,629 | SEK 238,000 | 100% | 0% | 0% | 8% | 66% | 27% | 130 |
| Backa centrala | 4,154 | SEK 288,000 | 42% | 54% | 4% | 15% | 77% | 35% | 142 |
| Backa östra | 2,088 | SEK 340,000 | 1% | 22% | 77% | 22% | 80% | 24% | 136 |
| Bagaregården | 3,456 | SEK 364,000 | 42% | 50% | 8% | 15% | 81% | 18% | 207 |
| Bergsjön Rymdtorget | 4,928 | SEK 225,000 | 87% | 13% | 0% | 7% | 62% | 49% | 111 |
| Bergsjön centrala | 2,856 | SEK 276,000 | 33% | 50% | 17% | 13% | 73% | 51% | 131 |
| Bergsjön nordvästra | 4,893 | SEK 219,000 | 100% | 0% | 0% | 12% | 63% | 47% | 148 |
| Bergsjön sydöstra | 2,630 | SEK 231,000 | 91% | 1% | 8% | 9% | 66% | 44% | 111 |
| Bergsjön södra | 2,941 | SEK 241,000 | 88% | 3% | 8% | 8% | 65% | 48% | 114 |
| Bergum | 5,341 | SEK 383,000 | 10% | 6% | 84% | 14% | 86% | 28% | 9 |
| Billdal Brottkärr | 4,451 | SEK 669,000 | 13% | 29% | 57% | 20% | 86% | 48% | 26 |
| Billdal Lindås | 5,058 | SEK 659,000 | 3% | 11% | 86% | 19% | 88% | 52% | 37 |
| Billdal Skintebo | 5,395 | SEK 486,000 | 20% | 46% | 34% | 18% | 89% | 44% | 50 |
| Björkekärr Delsjön | 1,983 | SEK 490,000 | 1% | 36% | 64% | 17% | 89% | 43% | 118 |
| Björkekärr Rosendal | 1,923 | SEK 275,000 | 86% | 3% | 11% | 14% | 56% | 37% | 167 |
| Björkekärr Östra sjukhuset | 6,772 | SEK 333,000 | 64% | 35% | 2% | 15% | 83% | 35% | 122 |
| Björlanda | 8,886 | SEK 484,000 | 4% | 16% | 80% | 12% | 88% | 34% | 26 |
| Bratthammar | 2,547 | SEK 470,000 | 3% | 0% | 97% | 22% | 87% | 31% | 183 |
| Brunnsbo norra | 2,629 | SEK 360,000 | 29% | 2% | 70% | 16% | 77% | 15% | 42 |
| Brunnsbo torg | 4,723 | SEK 286,000 | 84% | 1% | 15% | 15% | 70% | 28% | 49 |
| Eriksberg | 9,976 | SEK 535,000 | 19% | 79% | 2% | 26% | 86% | 19% | 193 |
| Eriksbo | 2,575 | SEK 228,000 | 84% | 16% | 0% | 11% | 60% | 50% | 98 |
| Fiskebäck Tranered | 2,107 | SEK 576,000 | 4% | 11% | 86% | 21% | 87% | 18% | 100 |
| Fiskebäck södra | 5,411 | SEK 518,000 | 6% | 8% | 86% | 25% | 87% | 35% | 103 |
| Flatås västra | 3,456 | SEK 320,000 | 43% | 57% | 0% | 13% | 83% | 34% | 203 |
| Frölunda torg västra | 4,333 | SEK 294,000 | 73% | 25% | 3% | 11% | 72% | 33% | 240 |
| Frölunda torg östra | 4,322 | SEK 252,000 | 93% | 7% | 0% | 17% | 68% | 31% | 227 |
| Gamlestaden Kviberg | 6,416 | SEK 314,000 | 48% | 50% | 2% | 13% | 78% | 37% | 128 |
| Gamlestaden västra | 5,825 | SEK 287,000 | 61% | 39% | 0% | 9% | 76% | 10% | 128 |
| Grevegården | 4,778 | SEK 268,000 | 81% | 19% | 0% | 15% | 71% | 39% | 218 |
| Grimmered | 4,353 | SEK 531,000 | 5% | 2% | 93% | 20% | 86% | 31% | 146 |
| Guldheden mellersta | 2,869 | SEK 343,000 | 73% | 22% | 5% | 19% | 73% | 31% | 219 |
| Guldheden norra | 1,784 | SEK 406,000 | 15% | 85% | 0% | 16% | 82% | 42% | 555 |
| Guldheden södra | 5,712 | SEK 311,000 | 73% | 27% | 0% | 17% | 73% | 32% | 139 |
| Guldringen | 2,474 | SEK 311,000 | 35% | 65% | 0% | 19% | 79% | 32% | 142 |
| Gårdsten nordöstra | 5,896 | SEK 245,000 | 92% | 3% | 5% | 9% | 69% | 39% | 38 |
| Gårdsten sydvästra | 4,681 | SEK 244,000 | 76% | 20% | 4% | 10% | 68% | 34% | 42 |
| Haga | 3,844 | SEK 430,000 | 84% | 17% | 0% | 26% | 81% | 11% | 722 |
| Hagen | 5,792 | SEK 569,000 | 24% | 12% | 63% | 22% | 85% | 21% | 99 |
| Hammarkullen centrala | 5,000 | SEK 206,000 | 95% | 3% | 2% | 10% | 59% | 32% | 52 |
| Hammarkullen yttre | 3,434 | SEK 250,000 | 49% | 0% | 51% | 14% | 67% | 48% | 65 |
| Heden västra | 4,626 | SEK 479,000 | 55% | 45% | 0% | 26% | 79% | 15% | 746 |
| Heden östra | 1,263 | SEK 339,000 | 69% | 31% | 0% | 21% | 64% | 10% | 663 |
| Hjuvik | 7,499 | SEK 601,000 | 1% | 12% | 87% | 17% | 87% | 8% | 29 |
| Hjällbo västra | 5,234 | SEK 218,000 | 97% | 0% | 3% | 10% | 63% | 35% | 68 |
| Hjällbo östra | 1,886 | SEK 245,000 | 86% | 0% | 14% | 14% | 65% | 27% | 76 |
| Hovås | 3,661 | SEK 803,000 | 7% | 17% | 76% | 21% | 85% | 23% | 17 |
| Högsbo-Flatås östra | 1,716 | SEK 298,000 | 78% | 22% | 0% | 13% | 78% | 24% | 188 |
| Högsbohöjd norra | 3,065 | SEK 319,000 | 78% | 14% | 8% | 8% | 79% | 33% | 186 |
| Högsbohöjd södra | 2,187 | SEK 302,000 | 94% | 0% | 6% | 15% | 77% | 38% | 205 |
| Högsbotorp västra | 4,470 | SEK 291,000 | 80% | 20% | 0% | 23% | 75% | 36% | 221 |
| Högsbotorp östra | 3,749 | SEK 311,000 | 55% | 44% | 1% | 18% | 80% | 29% | 210 |
| Inom Vallgraven | 4,038 | SEK 503,000 | 43% | 57% | 0% | 21% | 80% | 8% | 739 |
| Johanneberg Chalmers | 4,177 | SEK 370,000 | 74% | 26% | 0% | 17% | 61% | 20% | 535 |
| Johanneberg västra | 3,978 | SEK 340,000 | 53% | 47% | 0% | 13% | 75% | 21% | 402 |
| Järnbrott | 4,270 | SEK 332,000 | 58% | 28% | 14% | 23% | 80% | 35% | 158 |
| Jättesten västra | 2,241 | SEK 364,000 | 40% | 0% | 60% | 13% | 77% | 17% | 128 |
| Jättesten östra | 5,532 | SEK 304,000 | 51% | 38% | 12% | 14% | 78% | 32% | 139 |
| Kallebäck västra | 4,794 | SEK 295,000 | 82% | 18% | 0% | 7% | 77% | 17% | 124 |
| Kallebäck östra | 1,945 | SEK 332,000 | 80% | 18% | 2% | 14% | 80% | 43% | 90 |
| Kannebäck | 3,866 | SEK 289,000 | 61% | 27% | 12% | 14% | 72% | 41% | 206 |
| Kaverös | 4,366 | SEK 323,000 | 35% | 65% | 0% | 20% | 79% | 40% | 211 |
| Kortedala södra | 1,743 | SEK 311,000 | 82% | 3% | 15% | 17% | 76% | 76% | 131 |
| Kortedala nordvästra | 4,713 | SEK 268,000 | 60% | 34% | 5% | 13% | 72% | 36% | 109 |
| Kortedala nordöstra | 4,832 | SEK 249,000 | 76% | 17% | 7% | 13% | 66% | 42% | 118 |
| Kortedala sydöstra | 6,182 | SEK 229,000 | 91% | 9% | 1% | 15% | 63% | 33% | 99 |
| Krokslätt Mossen | 1,531 | SEK 215,000 | 88% | 12% | 1% | 5% | 41% | 23% | 233 |
| Krokslätt norra | 4,952 | SEK 378,000 | 66% | 32% | 2% | 17% | 81% | 20% | 384 |
| Krokslätt södra | 8,563 | SEK 357,000 | 54% | 41% | 4% | 10% | 80% | 13% | 211 |
| Kungsladugård Kungsladugårdsgatan | 5,250 | SEK 339,000 | 70% | 16% | 14% | 18% | 75% | 28% | 219 |
| Kungsladugård Älvsborgsgatan | 6,260 | SEK 333,000 | 69% | 31% | 0% | 15% | 79% | 18% | 226 |
| Kvillebäcken Backaplan | 4,230 | SEK 362,000 | 50% | 50% | 0% | 6% | 84% | 13% | 218 |
| Kvillebäcken Björlandavägen | 4,922 | SEK 322,000 | 52% | 29% | 19% | 13% | 77% | 35% | 143 |
| Kvillebäcken Wieselgrensplatsen | 4,987 | SEK 286,000 | 71% | 27% | 2% | 12% | 76% | 18% | 223 |
| Kyrkbyn Bräcke | 4,998 | SEK 334,000 | 63% | 8% | 30% | 13% | 79% | 25% | 142 |
| Kyrkbyn östra | 3,270 | SEK 302,000 | 83% | 14% | 4% | 19% | 74% | 17% | 119 |
| Kärra Gerrebacka | 4,119 | SEK 437,000 | 2% | 40% | 57% | 9% | 89% | 53% | 35 |
| Kärra centrum | 6,371 | SEK 337,000 | 7% | 70% | 23% | 24% | 85% | 22% | 66 |
| Kärralund | 3,381 | SEK 438,000 | 36% | 57% | 7% | 20% | 85% | 41% | 92 |
| Kärrdalen | 5,279 | SEK 402,000 | 4% | 1% | 95% | 16% | 84% | 77% | 71 |
| Kålltorp Munkebäckstorget | 2,912 | SEK 319,000 | 69% | 31% | 0% | 11% | 82% | 18% | 155 |
| Kålltorp Vidkärr | 3,650 | SEK 346,000 | 49% | 49% | 2% | 15% | 84% | 13% | 150 |
| Kålltorp södra | 3,390 | SEK 409,000 | 41% | 47% | 12% | 17% | 86% | 36% | 145 |
| Landala norra | 3,406 | SEK 372,000 | 82% | 18% | 0% | 21% | 80% | 21% | 860 |
| Landala södra | 1,540 | SEK 277,000 | 100% | 0% | 0% | 22% | 68% | 25% | 644 |
| Lindholmen | 6,676 | SEK 375,000 | 37% | 61% | 2% | 12% | 75% | 8% | 243 |
| Linnarhult-Gunnilse | 2,524 | SEK 348,000 | 6% | 0% | 94% | 16% | 79% | 47% | 11 |
| Lorensberg-Vasastaden övre | 3,786 | SEK 589,000 | 57% | 43% | 0% | 23% | 78% | 13% | 835 |
| Lunden Danska vägen | 3,504 | SEK 354,000 | 75% | 26% | 0% | 13% | 86% | 14% | 208 |
| Lunden västra | 3,812 | SEK 349,000 | 75% | 23% | 2% | 12% | 84% | 16% | 221 |
| Lunden östra-Härlanda | 6,206 | SEK 420,000 | 47% | 35% | 19% | 15% | 84% | 20% | 168 |
| Länsmansgården norra | 3,922 | SEK 272,000 | 67% | 31% | 2% | 12% | 72% | 41% | 98 |
| Länsmansgården södra | 1,883 | SEK 219,000 | 100% | 0% | 0% | 8% | 62% | 35% | 119 |
| Långedrag | 2,105 | SEK 962,000 | 3% | 11% | 86% | 23% | 83% | 14% | 62 |
| Lövgärdet | 8,223 | SEK 236,000 | 88% | 7% | 5% | 13% | 63% | 50% | 48 |
| Majorna Gråberget | 4,408 | SEK 362,000 | 33% | 68% | 0% | 23% | 83% | 23% | 263 |
| Majorna Hängmattan | 3,473 | SEK 325,000 | 84% | 16% | 0% | 23% | 79% | 11% | 351 |
| Majorna Såggatan | 3,073 | SEK 337,000 | 75% | 25% | 0% | 15% | 82% | 27% | 313 |
| Masthugget Masthuggsterassen | 4,513 | SEK 388,000 | 21% | 79% | 0% | 23% | 83% | 8% | 596 |
| Masthugget övre Bangatan | 3,994 | SEK 351,000 | 38% | 62% | 0% | 16% | 79% | 16% | 499 |
| Masthugget övre Vegagatan | 3,117 | SEK 359,000 | 56% | 44% | 0% | 20% | 80% | 23% | 571 |
| Nolered Amhult-Arendal | 7,283 | SEK 407,000 | 32% | 23% | 44% | 21% | 89% | 38% | 77 |
| Nolered norra | 4,018 | SEK 442,000 | 3% | 30% | 67% | 20% | 89% | 46% | 75 |
| Norra Biskopsgården | 5,340 | SEK 228,000 | 90% | 8% | 1% | 9% | 64% | 31% | 135 |
| Näset | 6,065 | SEK 675,000 | 4% | 1% | 94% | 22% | 86% | 35% | 64 |
| Olivedal Järntorget | 1,969 | SEK 487,000 | 27% | 73% | 0% | 15% | 80% | 10% | 696 |
| Olivedal Kommendantsängen | 4,322 | SEK 447,000 | 34% | 66% | 0% | 23% | 81% | 16% | 644 |
| Olivedal nordvästra | 4,872 | SEK 483,000 | 41% | 59% | 0% | 22% | 82% | 17% | 636 |
| Olofshöjd | 1,857 | SEK 148,000 | 98% | 1% | 1% | 1% | 38% | 9% | 261 |
| Olskroken | 5,765 | SEK 329,000 | 72% | 29% | 0% | 17% | 82% | 15% | 206 |
| Rambergsstaden mellersta | 6,222 | SEK 312,000 | 53% | 46% | 1% | 13% | 79% | 24% | 240 |
| Rambergsstaden västra | 2,036 | SEK 247,000 | 92% | 8% | 0% | 10% | 65% | 46% | 275 |
| Rambergsstaden östra | 2,899 | SEK 336,000 | 38% | 62% | 0% | 14% | 81% | 16% | 233 |
| Rannebergen norra | 2,464 | SEK 268,000 | 50% | 0% | 50% | 17% | 67% | 49% | 101 |
| Rannebergen södra | 2,603 | SEK 214,000 | 100% | 0% | 0% | 14% | 55% | 49% | 101 |
| Redbergslid | 2,716 | SEK 379,000 | 44% | 55% | 1% | 11% | 86% | 14% | 192 |
| Ruddalen | 2,722 | SEK 318,000 | 17% | 80% | 3% | 27% | 78% | 60% | 208 |
| Rödbo-Säve | 3,718 | SEK 394,000 | 12% | 3% | 85% | 16% | 85% | 44% | 12 |
| Sanna | 3,557 | SEK 309,000 | 70% | 30% | 0% | 15% | 72% | 25% | 216 |
| Skattegården | 2,878 | SEK 302,000 | 87% | 9% | 4% | 19% | 78% | 31% | 270 |
| Skogome | 3,688 | SEK 370,000 | 40% | 32% | 27% | 15% | 85% | 53% | 57 |
| Skälltorp Bäckebol | 5,885 | SEK 301,000 | 4% | 89% | 7% | 21% | 78% | 27% | 118 |
| Skälltorp Selma Lagerlöfs torg | 3,176 | SEK 264,000 | 87% | 13% | 0% | 13% | 70% | 25% | 135 |
| Skälltorp Åketorp | 2,071 | SEK 390,000 | 3% | 48% | 49% | 23% | 86% | 58% | 34 |
| Skår | 4,524 | SEK 693,000 | 33% | 17% | 50% | 20% | 82% | 18% | 204 |
| Slättadamm | 4,262 | SEK 331,000 | 44% | 48% | 8% | 14% | 80% | 40% | 132 |
| Stampen västra | 3,208 | SEK 351,000 | 80% | 20% | 0% | 10% | 81% | 10% | 509 |
| Stampen östra | 3,636 | SEK 370,000 | 49% | 52% | 0% | 20% | 81% | 12% | 597 |
| Stigberget | 7,737 | SEK 317,000 | 85% | 15% | 0% | 13% | 80% | 15% | 403 |
| Svartedalen | 4,630 | SEK 265,000 | 56% | 43% | 1% | 15% | 70% | 27% | 144 |
| Södra Biskopsgården västra | 3,982 | SEK 249,000 | 76% | 18% | 5% | 16% | 69% | 36% | 108 |
| Södra Biskopsgården östra | 4,465 | SEK 257,000 | 100% | 0% | 0% | 6% | 69% | 38% | 135 |
| Södra Skärgården | 4,695 | SEK 426,000 | 11% | 8% | 82% | 32% | 86% | 10% | 20 |
| Tofta | 2,837 | SEK 262,000 | 93% | 8% | 0% | 29% | 70% | 40% | 205 |
| Torpa | 3,886 | SEK 359,000 | 60% | 10% | 30% | 19% | 79% | 17% | 166 |
| Tuve Norumshöjd | 2,281 | SEK 256,000 | 100% | 0% | 0% | 13% | 68% | 40% | 100 |
| Tuve västra | 3,768 | SEK 340,000 | 3% | 73% | 25% | 20% | 84% | 77% | 106 |
| Tuve östra | 4,623 | SEK 384,000 | 14% | 35% | 51% | 20% | 86% | 45% | 103 |
| Utby | 6,593 | SEK 396,000 | 24% | 6% | 70% | 11% | 88% | 32% | 95 |
| Vasastaden västra | 5,102 | SEK 542,000 | 54% | 46% | 0% | 19% | 78% | 20% | 914 |
| Ängås | 4,056 | SEK 287,000 | 60% | 25% | 16% | 18% | 72% | 34% | 242 |
| Önnered | 3,918 | SEK 470,000 | 17% | 11% | 72% | 23% | 86% | 38% | 169 |
| Överås | 2,631 | SEK 836,000 | 43% | 17% | 40% | 20% | 80% | 23% | 163 |
Sources: Statistics Sweden (SCB), Statistical Database (CC0) · © OpenStreetMap contributors (ODbL)
People.
Age and households on 31 December 2025, next to the figure for Västra Götaland County.
298,120 households
Population on 31 December
Source: Statistics Sweden (SCB), Statistical Database (CC0)
Income and work.
Incomes and employment in 2024, from Statistics Sweden registers.
Education, aged 25–65
Net income is the sum of all taxable and tax-free income minus tax, for registered residents aged 20 and over, at 2024 prices.
Low economic standard means a household’s disposable income per consumption unit is below 60 per cent of the national median; high economic standard means it is more than twice the median. It describes incomes, not what an area is like to live in.
Employment and unemployment come from Statistics Sweden’s annual register of labour-market status and can differ from the Labour Force Survey.
Source: Statistics Sweden (SCB), Statistical Database (CC0)
Homes.
312,428 homes by tenure, 2025.
Average sale price of houses for permanent living
Prices cover registered sales of houses for permanent living (one- and two-dwelling houses) during the year, and depend on which houses happen to be sold.
Source: Statistics Sweden (SCB), Statistical Database (CC0)
Everyday life.
201 everyday shops and services within a 15-minute walk; 30% green space within 500 metres.
Services and green space are measured from each DeSO area’s service centre: the point inside the area with the most shops and facilities within 500 metres. Larger areas show a population-weighted average.
Source: © OpenStreetMap contributors (ODbL)
Around here.
Photographs taken near Gothenburg, shared on Wikimedia Commons under free licences.

i


i


i
Photo: W.carter · CC BY-SA 4.0
View on Wikimedia Commons

Other municipalities in Västra Götaland County.