California
California has 39,287,377 residents in 58 counties and 1,689 ZIP codes. The median household income is $99,122, 23% above the national figure, and the typical owner-occupied home is valued at $734,700. 56% of households own their home.
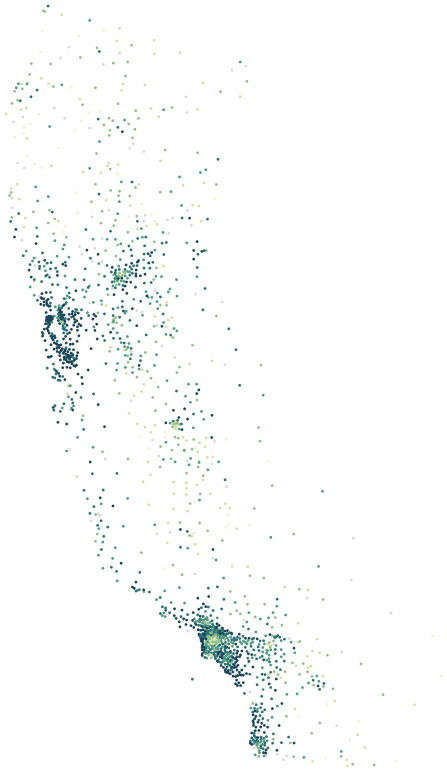
Sources: U.S. Census Bureau, American Community Survey 2020–2024 5-year estimates · U.S. Census Bureau, 2024 Gazetteer and 2020 ZCTA relationship files
All 58 counties.
Colour shows where each county sits among the others in the table, from lowest to highest.
| County | Residents | Household income | Home value | Owners | Bachelor's+ | Broadband | Commute |
|---|---|---|---|---|---|---|---|
| Alameda County | 1,649,473 | $129K | $1.09M | 54% | 52% | 94% | 34 min |
| Alpine County | 1,616 | $106K | $590K | 78% | 41% | 91% | 32 min |
| Amador County | 41,428 | $88K | $450K | 80% | 22% | 88% | 35 min |
| Butte County | 207,929 | $68K | $425K | 57% | 32% | 92% | 22 min |
| Calaveras County | 46,248 | $79K | $457K | 84% | 24% | 86% | 36 min |
| Colusa County | 21,984 | $76K | $393K | 62% | 16% | 85% | 27 min |
| Contra Costa County | 1,165,012 | $127K | $867K | 68% | 45% | 96% | 38 min |
| Del Norte County | 27,107 | $67K | $342K | 70% | 21% | 91% | 19 min |
| El Dorado County | 192,662 | $109K | $680K | 77% | 40% | 93% | 30 min |
| Fresno County | 1,016,725 | $74K | $389K | 56% | 24% | 89% | 25 min |
| Glenn County | 28,494 | $67K | $352K | 61% | 15% | 90% | 24 min |
| Humboldt County | 134,541 | $61K | $447K | 57% | 33% | 91% | 20 min |
| Imperial County | 180,202 | $58K | $310K | 57% | 16% | 90% | 23 min |
| Inyo County | 18,739 | $74K | $349K | 66% | 32% | 85% | 18 min |
| Kern County | 915,075 | $70K | $338K | 60% | 19% | 92% | 26 min |
| Kings County | 153,298 | $71K | $324K | 54% | 14% | 87% | 25 min |
| Lake County | 68,152 | $61K | $324K | 72% | 18% | 87% | 33 min |
| Lassen County | 30,356 | $67K | $265K | 68% | 13% | 89% | 21 min |
| Los Angeles County | 9,808,667 | $90K | $834K | 46% | 36% | 93% | 33 min |
| Madera County | 160,940 | $77K | $393K | 68% | 18% | 91% | 29 min |
| Marin County | 257,969 | $149K | $1.51M | 65% | 61% | 96% | 30 min |
| Mariposa County | 17,082 | $68K | $388K | 75% | 32% | 88% | 33 min |
| Mendocino County | 90,244 | $68K | $512K | 62% | 25% | 90% | 23 min |
| Merced County | 290,201 | $66K | $392K | 54% | 15% | 88% | 32 min |
| Modoc County | 8,600 | $59K | $225K | 77% | 25% | 87% | 23 min |
| Mono County | 13,148 | $99K | $639K | 65% | 32% | 92% | 18 min |
| Monterey County | 437,613 | $97K | $781K | 52% | 28% | 94% | 27 min |
| Napa County | 134,869 | $111K | $870K | 63% | 40% | 94% | 27 min |
| Nevada County | 102,481 | $90K | $622K | 76% | 42% | 93% | 25 min |
| Orange County | 3,165,820 | $116K | $963K | 56% | 44% | 95% | 29 min |
| Placer County | 419,156 | $116K | $688K | 75% | 43% | 94% | 29 min |
| Plumas County | 19,423 | $66K | $360K | 75% | 23% | 86% | 22 min |
| Riverside County | 2,478,600 | $93K | $557K | 69% | 26% | 94% | 36 min |
| Sacramento County | 1,594,006 | $92K | $534K | 59% | 34% | 94% | 29 min |
| San Benito County | 67,290 | $114K | $793K | 68% | 24% | 95% | 39 min |
| San Bernardino County | 2,197,104 | $85K | $505K | 62% | 23% | 93% | 34 min |
| San Diego County | 3,288,774 | $106K | $855K | 55% | 43% | 95% | 28 min |
| San Francisco County | 830,235 | $141K | $1.39M | 38% | 60% | 93% | 33 min |
| San Joaquin County | 797,334 | $92K | $531K | 62% | 23% | 93% | 35 min |
| San Luis Obispo County | 281,555 | $97K | $825K | 62% | 40% | 93% | 23 min |
| San Mateo County | 742,340 | $159K | $1.56M | 59% | 54% | 96% | 29 min |
| Santa Barbara County | 443,701 | $98K | $791K | 52% | 37% | 93% | 23 min |
| Santa Clara County | 1,902,047 | $164K | $1.49M | 55% | 57% | 96% | 29 min |
| Santa Cruz County | 264,926 | $111K | $1.03M | 60% | 44% | 94% | 28 min |
| Shasta County | 181,436 | $73K | $366K | 66% | 24% | 91% | 21 min |
| Sierra County | 2,746 | $63K | $332K | 72% | 26% | 80% | 26 min |
| Siskiyou County | 43,466 | $59K | $310K | 69% | 23% | 89% | 23 min |
| Solano County | 451,918 | $100K | $618K | 63% | 29% | 94% | 33 min |
| Sonoma County | 485,040 | $105K | $816K | 63% | 39% | 94% | 27 min |
| Stanislaus County | 553,990 | $81K | $450K | 61% | 20% | 92% | 32 min |
| Sutter County | 98,857 | $80K | $434K | 61% | 21% | 91% | 29 min |
| Tehama County | 65,167 | $64K | $340K | 67% | 19% | 88% | 25 min |
| Trinity County | 15,860 | $53K | $326K | 72% | 22% | 82% | 28 min |
| Tulare County | 478,693 | $71K | $330K | 59% | 17% | 90% | 26 min |
| Tuolumne County | 54,498 | $77K | $433K | 74% | 25% | 89% | 30 min |
| Ventura County | 837,469 | $110K | $823K | 65% | 36% | 94% | 28 min |
| Yolo County | 220,564 | $92K | $621K | 54% | 45% | 92% | 26 min |
| Yuba County | 84,507 | $76K | $412K | 64% | 18% | 92% | 34 min |
Source: U.S. Census Bureau, American Community Survey 2020–2024 5-year estimates
People.
39,287,377 residents in 13,548,091 households, next to the United States figure.
Source: U.S. Census Bureau, American Community Survey 2020–2024 5-year estimates
Homes.
14,644,735 housing units; the median owner-occupied home is valued at $734,700 (±$1,307).
When homes were built
Source: U.S. Census Bureau, American Community Survey 2020–2024 5-year estimates
Income and work.
Household income and work, in 2024 dollars; median household income ±$310.
The poverty rate uses the federal poverty thresholds, which vary with family size. It says nothing on its own about what a neighborhood is like to live in.
Source: U.S. Census Bureau, American Community Survey 2020–2024 5-year estimates
Getting around.
How workers aged 16 and over get to work, and how long it takes.
Source: U.S. Census Bureau, American Community Survey 2020–2024 5-year estimates
Internet.
Home internet subscriptions.
American Community Survey figures are estimates from a rolling sample, averaged over 2020–2024. Each comes with a margin of error, which is wider in places with fewer people.
Source: U.S. Census Bureau, American Community Survey 2020–2024 5-year estimates
Counties in California.
Every county has its own page, with all of its ZIP codes.