Colorado
Colorado has 5,862,189 residents in 64 counties and 484 ZIP codes. The median household income is $95,470, 18% above the national figure, and the typical owner-occupied home is valued at $539,400. 66% of households own their home.
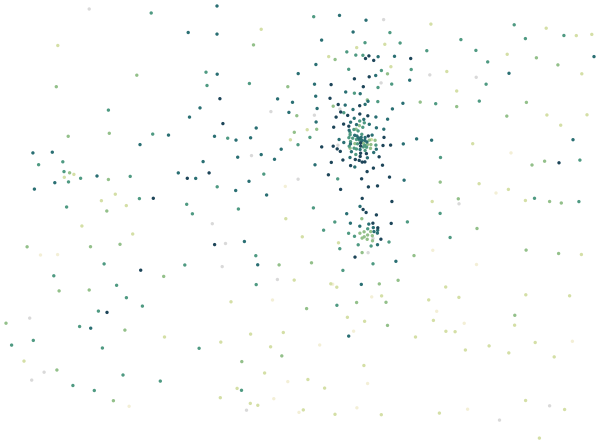
Sources: U.S. Census Bureau, American Community Survey 2020–2024 5-year estimates · U.S. Census Bureau, 2024 Gazetteer and 2020 ZCTA relationship files
All 64 counties.
Colour shows where each county sits among the others in the table, from lowest to highest.
| County | Residents | Household income | Home value | Owners | Bachelor's+ | Broadband | Commute |
|---|---|---|---|---|---|---|---|
| Adams County | 530,225 | $95K | $484K | 69% | 29% | 93% | 32 min |
| Alamosa County | 16,581 | $55K | $239K | 56% | 32% | 92% | 17 min |
| Arapahoe County | 659,844 | $101K | $561K | 65% | 47% | 95% | 29 min |
| Archuleta County | 13,900 | $83K | $478K | 80% | 41% | 90% | 25 min |
| Baca County | 3,428 | $46K | $123K | 72% | 25% | 84% | 14 min |
| Bent County | 5,549 | $50K | $147K | 65% | 16% | 83% | 23 min |
| Boulder County | 328,961 | $104K | $756K | 62% | 64% | 96% | 24 min |
| Broomfield County | 76,304 | $124K | $665K | 63% | 60% | 97% | 27 min |
| Chaffee County | 20,178 | $84K | $666K | 74% | 47% | 90% | 19 min |
| Cheyenne County | 1,741 | $71K | $188K | 73% | 26% | 91% | 16 min |
| Clear Creek County | 9,262 | $95K | $609K | 82% | 58% | 90% | 31 min |
| Conejos County | 7,530 | $51K | $193K | 77% | 26% | 84% | 25 min |
| Costilla County | 3,607 | $37K | $185K | 79% | 25% | 88% | 25 min |
| Crowley County | 5,647 | $49K | $116K | 70% | 12% | 84% | 32 min |
| Custer County | 5,247 | $73K | $392K | 85% | 44% | 80% | 36 min |
| Delta County | 31,598 | $58K | $343K | 78% | 27% | 82% | 26 min |
| Denver County | 718,877 | $95K | $616K | 49% | 57% | 93% | 27 min |
| Dolores County | 2,432 | $65K | $248K | 81% | 28% | 81% | 19 min |
| Douglas County | 377,150 | $150K | $714K | 77% | 62% | 98% | 29 min |
| Eagle County | 55,135 | $104K | $840K | 66% | 51% | 95% | 24 min |
| El Paso County | 742,999 | $90K | $461K | 66% | 42% | 95% | 25 min |
| Elbert County | 27,874 | $133K | $710K | 95% | 36% | 95% | 45 min |
| Fremont County | 49,634 | $63K | $324K | 76% | 22% | 85% | 26 min |
| Garfield County | 62,479 | $91K | $528K | 70% | 34% | 94% | 34 min |
| Gilpin County | 5,901 | $95K | $574K | 88% | 53% | 93% | 35 min |
| Grand County | 15,895 | $89K | $602K | 73% | 43% | 91% | 26 min |
| Gunnison County | 17,241 | $85K | $622K | 67% | 65% | 92% | 22 min |
| Hinsdale County | 1,005 | $76K | $438K | 76% | 48% | 94% | 9 min |
| Huerfano County | 6,972 | $53K | $248K | 75% | 26% | 78% | 22 min |
| Jackson County | 1,372 | $48K | $240K | 71% | 31% | 80% | 14 min |
| Jefferson County | 579,377 | $111K | $638K | 71% | 52% | 95% | 28 min |
| Kiowa County | 1,376 | $59K | $162K | 69% | 20% | 85% | 19 min |
| Kit Carson County | 7,023 | $70K | $240K | 73% | 20% | 89% | 18 min |
| La Plata County | 56,331 | $86K | $592K | 71% | 49% | 90% | 22 min |
| Lake County | 7,380 | $97K | $466K | 76% | 50% | 89% | 28 min |
| Larimer County | 367,368 | $94K | $569K | 64% | 53% | 93% | 25 min |
| Las Animas County | 14,413 | $52K | $238K | 69% | 19% | 87% | 20 min |
| Lincoln County | 5,550 | $63K | $247K | 72% | 26% | 82% | 25 min |
| Logan County | 20,892 | $52K | $245K | 66% | 20% | 85% | 19 min |
| Mesa County | 158,601 | $74K | $379K | 73% | 32% | 93% | 20 min |
| Mineral County | 729 | $56K | $431K | 70% | 52% | 91% | 14 min |
| Moffat County | 13,207 | $74K | $290K | 69% | 19% | 90% | 23 min |
| Montezuma County | 26,412 | $65K | $331K | 76% | 31% | 85% | 22 min |
| Montrose County | 43,807 | $72K | $388K | 75% | 29% | 88% | 23 min |
| Morgan County | 29,520 | $73K | $339K | 67% | 18% | 93% | 25 min |
| Otero County | 18,321 | $54K | $169K | 69% | 18% | 85% | 21 min |
| Ouray County | 5,087 | $91K | $740K | 83% | 57% | 91% | 31 min |
| Park County | 17,907 | $104K | $532K | 86% | 42% | 93% | 43 min |
| Phillips County | 4,496 | $65K | $258K | 72% | 32% | 83% | 20 min |
| Pitkin County | 16,985 | $103K | $1.14M | 63% | 63% | 93% | 22 min |
| Prowers County | 11,910 | $54K | $161K | 67% | 19% | 86% | 13 min |
| Pueblo County | 169,356 | $64K | $291K | 69% | 26% | 89% | 24 min |
| Rio Blanco County | 6,544 | $65K | $274K | 74% | 25% | 93% | 19 min |
| Rio Grande County | 11,321 | $64K | $240K | 67% | 35% | 88% | 21 min |
| Routt County | 25,084 | $106K | $855K | 76% | 54% | 93% | 21 min |
| Saguache County | 6,580 | $50K | $213K | 77% | 31% | 91% | 19 min |
| San Juan County | 724 | $78K | $433K | 53% | 52% | 87% | 16 min |
| San Miguel County | 7,968 | $79K | $721K | 63% | 65% | 85% | 19 min |
| Sedgwick County | 2,304 | $52K | $149K | 72% | 27% | 88% | 19 min |
| Summit County | 31,017 | $110K | $940K | 72% | 55% | 98% | 22 min |
| Teller County | 24,825 | $85K | $480K | 81% | 38% | 93% | 34 min |
| Washington County | 4,831 | $67K | $226K | 74% | 25% | 86% | 23 min |
| Weld County | 350,396 | $97K | $472K | 76% | 33% | 93% | 30 min |
| Yuma County | 9,979 | $61K | $212K | 69% | 25% | 91% | 17 min |
Source: U.S. Census Bureau, American Community Survey 2020–2024 5-year estimates
People.
5,862,189 residents in 2,374,218 households, next to the United States figure.
Source: U.S. Census Bureau, American Community Survey 2020–2024 5-year estimates
Homes.
2,589,053 housing units; the median owner-occupied home is valued at $539,400 (±$2,069).
When homes were built
Source: U.S. Census Bureau, American Community Survey 2020–2024 5-year estimates
Income and work.
Household income and work, in 2024 dollars; median household income ±$578.
The poverty rate uses the federal poverty thresholds, which vary with family size. It says nothing on its own about what a neighborhood is like to live in.
Source: U.S. Census Bureau, American Community Survey 2020–2024 5-year estimates
Getting around.
How workers aged 16 and over get to work, and how long it takes.
Source: U.S. Census Bureau, American Community Survey 2020–2024 5-year estimates
Internet.
Home internet subscriptions.
American Community Survey figures are estimates from a rolling sample, averaged over 2020–2024. Each comes with a margin of error, which is wider in places with fewer people.
Source: U.S. Census Bureau, American Community Survey 2020–2024 5-year estimates
Counties in Colorado.
Every county has its own page, with all of its ZIP codes.