Hampden County
Hampden County has 462,815 residents across 38 ZIP codes with their own report. Median household income is $71,306, 31% below the Massachusetts figure. The typical owner-occupied home is valued at $298,800, and 29% of adults 25 and over hold a bachelor’s degree or higher.
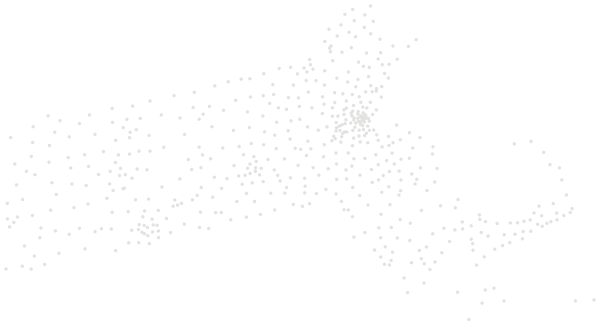
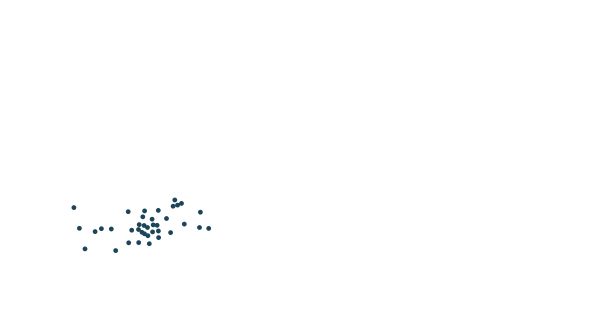
Sources: U.S. Census Bureau, American Community Survey 2020–2024 5-year estimates · U.S. Census Bureau, 2024 Gazetteer and 2020 ZCTA relationship files
All 38 ZIP codes.
Colour shows where each zip code sits among the others in the table, from lowest to highest.
| ZIP code | Residents | Household income | Home value | Owners | Bachelor's+ | Broadband | Commute |
|---|---|---|---|---|---|---|---|
| 01001 | 16,234 | $75K | $296K | 74% | 36% | 92% | 24 min |
| 01008 | 1,327 | $98K | $295K | 97% | 32% | 90% | 41 min |
| 01009 | 804 | $73K | $274K | 59% | 32% | 97% | 30 min |
| 01010 | 3,705 | $111K | $389K | 88% | 45% | 95% | 37 min |
| 01011 | 1,175 | $89K | $291K | 81% | 22% | 87% | 33 min |
| 01013 | 23,284 | $60K | $272K | 49% | 21% | 87% | 22 min |
| 01020 | 30,167 | $66K | $281K | 58% | 23% | 90% | 23 min |
| 01022 | 1,844 | $51K | $194K | 85% | 30% | 80% | 21 min |
| 01028 | 16,321 | $106K | $379K | 87% | 49% | 91% | 25 min |
| 01030 | 12,305 | $94K | $328K | 75% | 32% | 93% | 24 min |
| 01034 | 2,332 | $91K | $357K | 93% | 36% | 86% | 41 min |
| 01036 | 4,946 | $105K | $358K | 95% | 37% | 95% | 28 min |
| 01040 | 37,813 | $54K | $274K | 41% | 26% | 86% | 21 min |
| 01056 | 20,904 | $85K | $335K | 78% | 27% | 93% | 22 min |
| 01057 | 8,176 | $99K | $345K | 83% | 29% | 94% | 37 min |
| 01069 | 8,821 | $80K | $274K | 74% | 23% | 90% | 35 min |
| 01071 | 1,054 | $111K | $299K | 89% | 29% | 94% | 34 min |
| 01077 | 9,217 | $120K | $398K | 83% | 35% | 96% | 30 min |
| 01079 | 438 | $71K | $263K | 77% | 38% | 100% | 40 min |
| 01080 | 2,454 | $89K | $270K | 65% | 20% | 88% | 26 min |
| 01081 | 1,747 | $87K | $297K | 89% | 23% | 94% | 38 min |
| 01085 | 41,102 | $89K | $326K | 69% | 33% | 90% | 28 min |
| 01089 | 28,772 | $69K | $322K | 59% | 34% | 90% | 21 min |
| 01095 | 14,618 | $122K | $415K | 89% | 52% | 90% | 28 min |
| 01097 | 143 | $-666667K | $338K | 46% | 42% | 71% | 26 min |
| 01103 | 2,477 | $21K | $186K | 9% | 33% | 80% | 17 min |
| 01104 | 23,209 | $50K | $235K | 48% | 15% | 85% | 19 min |
| 01105 | 11,843 | $24K | $218K | 15% | 11% | 74% | 23 min |
| 01106 | 15,853 | $148K | $452K | 89% | 67% | 95% | 27 min |
| 01107 | 12,009 | $36K | $244K | 29% | 18% | 79% | 19 min |
| 01108 | 27,405 | $51K | $251K | 45% | 19% | 89% | 22 min |
| 01109 | 31,124 | $48K | $220K | 48% | 18% | 87% | 23 min |
| 01118 | 14,839 | $80K | $275K | 80% | 33% | 94% | 23 min |
| 01119 | 13,616 | $58K | $245K | 77% | 20% | 83% | 23 min |
| 01128 | 2,896 | $100K | $272K | 94% | 40% | 94% | 24 min |
| 01129 | 5,672 | $97K | $257K | 79% | 36% | 96% | 28 min |
| 01151 | 9,606 | $55K | $237K | 47% | 18% | 88% | 23 min |
| 01521 | 2,583 | $92K | $334K | 95% | 35% | 97% | 40 min |
Source: U.S. Census Bureau, American Community Survey 2020–2024 5-year estimates
People.
462,815 residents in 184,471 households, next to the Massachusetts figure.
Source: U.S. Census Bureau, American Community Survey 2020–2024 5-year estimates
Homes.
197,591 housing units; the median owner-occupied home is valued at $298,800 (±$3,575).
When homes were built
Source: U.S. Census Bureau, American Community Survey 2020–2024 5-year estimates
Income and work.
Household income and work, in 2024 dollars; median household income ±$1,758.
The poverty rate uses the federal poverty thresholds, which vary with family size. It says nothing on its own about what a neighborhood is like to live in.
Source: U.S. Census Bureau, American Community Survey 2020–2024 5-year estimates
Getting around.
How workers aged 16 and over get to work, and how long it takes.
Source: U.S. Census Bureau, American Community Survey 2020–2024 5-year estimates
Internet.
Home internet subscriptions.
American Community Survey figures are estimates from a rolling sample, averaged over 2020–2024. Each comes with a margin of error, which is wider in places with fewer people.
Source: U.S. Census Bureau, American Community Survey 2020–2024 5-year estimates
Around here.
Photographs taken near Hampden County, Massachusetts, shared on Wikimedia Commons under free licences.

i


i


i
Photo: Pi.1415926535 · CC BY-SA 3.0
View on Wikimedia Commons
