Norfolk County
Norfolk County has 730,082 residents across 40 ZIP codes with their own report. Median household income is $130,739, 26% above the Massachusetts figure. The typical owner-occupied home is valued at $683,900, and 59% of adults 25 and over hold a bachelor’s degree or higher.
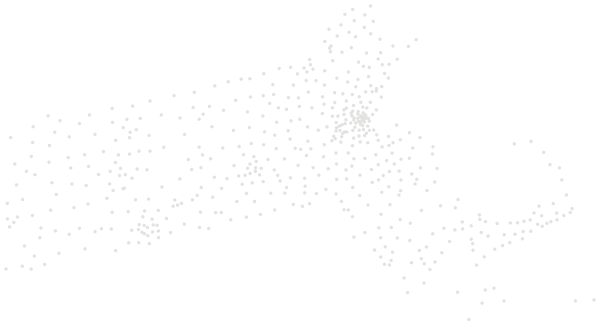
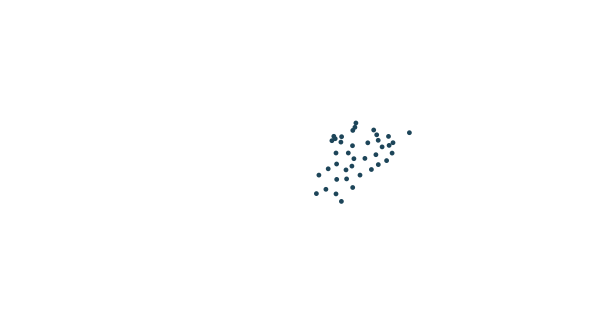
Sources: U.S. Census Bureau, American Community Survey 2020–2024 5-year estimates · U.S. Census Bureau, 2024 Gazetteer and 2020 ZCTA relationship files
All 40 ZIP codes.
Colour shows where each zip code sits among the others in the table, from lowest to highest.
| ZIP code | Residents | Household income | Home value | Owners | Bachelor's+ | Broadband | Commute |
|---|---|---|---|---|---|---|---|
| 02019 | 17,410 | $125K | $451K | 79% | 40% | 97% | 39 min |
| 02021 | 24,748 | $143K | $711K | 74% | 68% | 93% | 38 min |
| 02025 | 8,427 | $199K | $1.32M | 83% | 77% | 98% | 41 min |
| 02026 | 25,237 | $129K | $662K | 73% | 55% | 92% | 32 min |
| 02030 | 5,930 | $250K | $1.34M | 98% | 85% | 96% | 39 min |
| 02032 | 4,992 | $181K | $702K | 82% | 70% | 98% | 34 min |
| 02035 | 18,615 | $116K | $606K | 74% | 58% | 93% | 32 min |
| 02038 | 33,154 | $146K | $612K | 78% | 58% | 97% | 36 min |
| 02052 | 13,068 | $236K | $911K | 86% | 78% | 96% | 36 min |
| 02053 | 13,436 | $174K | $617K | 86% | 62% | 94% | 33 min |
| 02054 | 8,888 | $156K | $604K | 83% | 55% | 97% | 33 min |
| 02056 | 11,673 | $201K | $725K | 95% | 62% | 99% | 40 min |
| 02062 | 31,542 | $107K | $652K | 54% | 55% | 95% | 33 min |
| 02067 | 18,538 | $192K | $736K | 88% | 77% | 95% | 43 min |
| 02071 | 2,089 | $214K | $652K | 96% | 77% | 99% | 33 min |
| 02072 | 29,225 | $105K | $524K | 74% | 42% | 93% | 37 min |
| 02081 | 19,343 | $156K | $688K | 83% | 66% | 94% | 37 min |
| 02090 | 16,318 | $223K | $1.04M | 87% | 72% | 96% | 34 min |
| 02093 | 12,297 | $152K | $655K | 82% | 55% | 94% | 35 min |
| 02169 | 62,993 | $96K | $582K | 41% | 50% | 94% | 39 min |
| 02170 | 18,809 | $104K | $668K | 53% | 48% | 96% | 36 min |
| 02171 | 20,164 | $107K | $663K | 52% | 54% | 94% | 38 min |
| 02184 | 38,899 | $122K | $657K | 78% | 48% | 95% | 36 min |
| 02186 | 28,735 | $188K | $933K | 85% | 72% | 99% | 35 min |
| 02188 | 16,179 | $107K | $594K | 59% | 41% | 91% | 37 min |
| 02189 | 14,450 | $95K | $475K | 66% | 39% | 90% | 36 min |
| 02190 | 19,695 | $100K | $590K | 68% | 48% | 94% | 40 min |
| 02191 | 8,181 | $120K | $527K | 85% | 43% | 96% | 39 min |
| 02322 | 4,774 | $131K | $510K | 76% | 31% | 92% | 31 min |
| 02343 | 11,346 | $115K | $465K | 84% | 34% | 85% | 41 min |
| 02368 | 34,912 | $110K | $497K | 71% | 36% | 95% | 40 min |
| 02445 | 22,560 | $140K | $1.23M | 52% | 85% | 98% | 31 min |
| 02446 | 31,310 | $132K | $1.18M | 38% | 85% | 95% | 30 min |
| 02457 | 1,881 | $-666667K | $-666667K | – | – | – | 15 min |
| 02467 | 23,001 | $169K | $1.34M | 68% | 84% | 97% | 27 min |
| 02481 | 17,415 | $250K | $1.69M | 87% | 91% | 99% | 31 min |
| 02482 | 11,051 | $226K | $1.35M | 81% | 87% | 96% | 32 min |
| 02492 | 21,424 | $227K | $1.22M | 90% | 85% | 95% | 31 min |
| 02494 | 11,035 | $180K | $1.11M | 72% | 76% | 95% | 30 min |
| 02762 | 9,943 | $104K | $476K | 70% | 44% | 95% | 31 min |
Source: U.S. Census Bureau, American Community Survey 2020–2024 5-year estimates
People.
730,082 residents in 283,368 households, next to the Massachusetts figure.
Source: U.S. Census Bureau, American Community Survey 2020–2024 5-year estimates
Homes.
295,227 housing units; the median owner-occupied home is valued at $683,900 (±$5,690).
When homes were built
Source: U.S. Census Bureau, American Community Survey 2020–2024 5-year estimates
Income and work.
Household income and work, in 2024 dollars; median household income ±$2,551.
The poverty rate uses the federal poverty thresholds, which vary with family size. It says nothing on its own about what a neighborhood is like to live in.
Source: U.S. Census Bureau, American Community Survey 2020–2024 5-year estimates
Getting around.
How workers aged 16 and over get to work, and how long it takes.
Source: U.S. Census Bureau, American Community Survey 2020–2024 5-year estimates
Internet.
Home internet subscriptions.
American Community Survey figures are estimates from a rolling sample, averaged over 2020–2024. Each comes with a margin of error, which is wider in places with fewer people.
Source: U.S. Census Bureau, American Community Survey 2020–2024 5-year estimates
Around here.
Photographs taken near Norfolk County, Massachusetts, shared on Wikimedia Commons under free licences.

i


i


