St. Louis County
St. Louis County has 200,123 residents across 41 ZIP codes with their own report. Median household income is $70,069, 21% below the Minnesota figure. The typical owner-occupied home is valued at $221,400, and 34% of adults 25 and over hold a bachelor’s degree or higher.
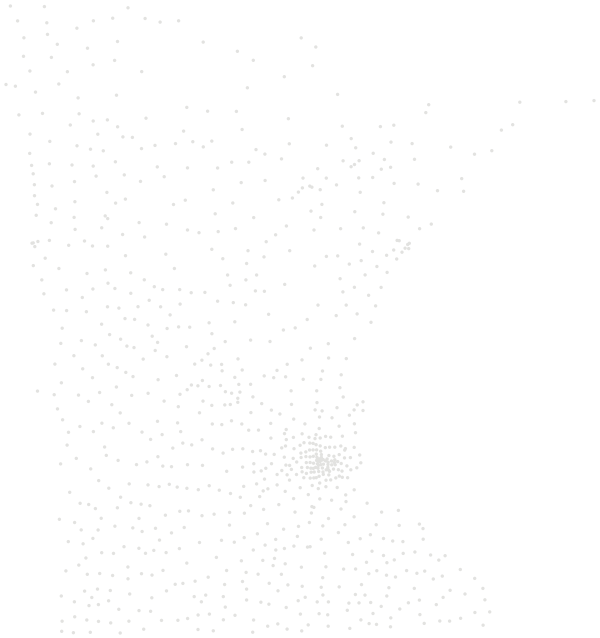

Sources: U.S. Census Bureau, American Community Survey 2020–2024 5-year estimates · U.S. Census Bureau, 2024 Gazetteer and 2020 ZCTA relationship files
All 41 ZIP codes.
Colour shows where each zip code sits among the others in the table, from lowest to highest.
| ZIP code | Residents | Household income | Home value | Owners | Bachelor's+ | Broadband | Commute |
|---|---|---|---|---|---|---|---|
| 55602 | 346 | $74K | $248K | 99% | 39% | 95% | 53 min |
| 55702 | 412 | $78K | $295K | 93% | 24% | 88% | 35 min |
| 55703 | 906 | $72K | $175K | 94% | 23% | 89% | 32 min |
| 55705 | 3,211 | $56K | $124K | 87% | 19% | 80% | 31 min |
| 55706 | 1,703 | $57K | $113K | 90% | 17% | 88% | 34 min |
| 55708 | 929 | $66K | $110K | 83% | 29% | 93% | 20 min |
| 55710 | 1,362 | $86K | $280K | 98% | 32% | 88% | 27 min |
| 55711 | 540 | $61K | $208K | 91% | 16% | 87% | 38 min |
| 55713 | 1,048 | $59K | $129K | 81% | 20% | 90% | 18 min |
| 55717 | 287 | $97K | $317K | 92% | 24% | 91% | 33 min |
| 55719 | 5,613 | $54K | $123K | 76% | 18% | 88% | 20 min |
| 55723 | 1,927 | $65K | $190K | 87% | 26% | 83% | 25 min |
| 55724 | 707 | $75K | $227K | 93% | 28% | 85% | 42 min |
| 55732 | 1,453 | $65K | $179K | 96% | 18% | 83% | 32 min |
| 55734 | 6,265 | $63K | $159K | 78% | 25% | 90% | 23 min |
| 55736 | 1,344 | $65K | $165K | 85% | 13% | 85% | 42 min |
| 55738 | 599 | $83K | $167K | 97% | 16% | 75% | 37 min |
| 55741 | 2,947 | $70K | $165K | 86% | 20% | 83% | 24 min |
| 55746 | 16,730 | $56K | $135K | 72% | 19% | 90% | 18 min |
| 55750 | 2,068 | $66K | $93K | 96% | 17% | 90% | 32 min |
| 55751 | 1,388 | $75K | $202K | 95% | 16% | 86% | 26 min |
| 55758 | 121 | $57K | $151K | 87% | 23% | 91% | 29 min |
| 55763 | 495 | $81K | $210K | 92% | 26% | 80% | 34 min |
| 55765 | 803 | $75K | $203K | 92% | 16% | 87% | 49 min |
| 55768 | 2,964 | $86K | $199K | 75% | 25% | 90% | 18 min |
| 55771 | 1,484 | $68K | $169K | 87% | 21% | 88% | 35 min |
| 55779 | 3,905 | $94K | $283K | 86% | 28% | 90% | 32 min |
| 55782 | 420 | $56K | $110K | 83% | 20% | 89% | 29 min |
| 55790 | 1,847 | $77K | $329K | 89% | 37% | 88% | 28 min |
| 55792 | 9,663 | $54K | $130K | 63% | 21% | 80% | 19 min |
| 55802 | 2,399 | $52K | $494K | 33% | 45% | 86% | 18 min |
| 55803 | 17,662 | $106K | $336K | 84% | 52% | 89% | 24 min |
| 55804 | 15,922 | $111K | $315K | 87% | 53% | 92% | 24 min |
| 55805 | 10,602 | $43K | $189K | 27% | 40% | 91% | 17 min |
| 55806 | 9,356 | $43K | $161K | 42% | 28% | 90% | 18 min |
| 55807 | 9,763 | $62K | $178K | 72% | 31% | 87% | 19 min |
| 55808 | 5,691 | $62K | $174K | 72% | 22% | 91% | 26 min |
| 55810 | 8,285 | $85K | $242K | 89% | 28% | 91% | 20 min |
| 55811 | 28,118 | $80K | $321K | 69% | 43% | 88% | 17 min |
| 55812 | 10,859 | $66K | $323K | 43% | 60% | 95% | 17 min |
| 55814 | 319 | $-666667K | $-666667K | – | 2% | – | – |
Source: U.S. Census Bureau, American Community Survey 2020–2024 5-year estimates
People.
200,123 residents in 87,115 households, next to the Minnesota figure.
Source: U.S. Census Bureau, American Community Survey 2020–2024 5-year estimates
Homes.
104,263 housing units; the median owner-occupied home is valued at $221,400 (±$3,411).
When homes were built
Source: U.S. Census Bureau, American Community Survey 2020–2024 5-year estimates
Income and work.
Household income and work, in 2024 dollars; median household income ±$1,494.
The poverty rate uses the federal poverty thresholds, which vary with family size. It says nothing on its own about what a neighborhood is like to live in.
Source: U.S. Census Bureau, American Community Survey 2020–2024 5-year estimates
Getting around.
How workers aged 16 and over get to work, and how long it takes.
Source: U.S. Census Bureau, American Community Survey 2020–2024 5-year estimates
Internet.
Home internet subscriptions.
American Community Survey figures are estimates from a rolling sample, averaged over 2020–2024. Each comes with a margin of error, which is wider in places with fewer people.
Source: U.S. Census Bureau, American Community Survey 2020–2024 5-year estimates