Minnesota
Minnesota has 5,739,445 residents in 87 counties and 853 ZIP codes. The median household income is $89,062, 10% above the national figure, and the typical owner-occupied home is valued at $329,300. 72% of households own their home.
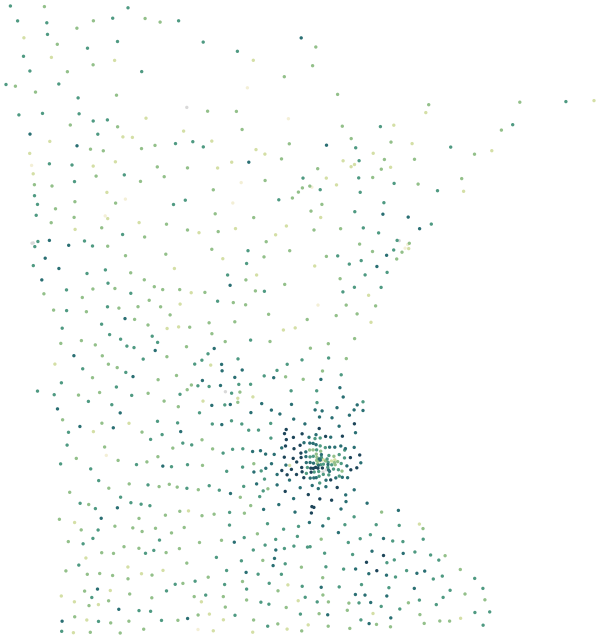
Sources: U.S. Census Bureau, American Community Survey 2020–2024 5-year estimates · U.S. Census Bureau, 2024 Gazetteer and 2020 ZCTA relationship files
All 87 counties.
Colour shows where each county sits among the others in the table, from lowest to highest.
| County | Residents | Household income | Home value | Owners | Bachelor's+ | Broadband | Commute |
|---|---|---|---|---|---|---|---|
| Aitkin County | 16,056 | $61K | $256K | 85% | 20% | 85% | 29 min |
| Anoka County | 370,349 | $102K | $347K | 80% | 32% | 94% | 28 min |
| Becker County | 35,343 | $71K | $291K | 77% | 28% | 89% | 23 min |
| Beltrami County | 46,512 | $69K | $238K | 70% | 32% | 92% | 22 min |
| Benton County | 41,593 | $74K | $271K | 67% | 26% | 91% | 25 min |
| Big Stone County | 5,127 | $70K | $169K | 80% | 26% | 90% | 20 min |
| Blue Earth County | 69,871 | $74K | $267K | 61% | 34% | 89% | 18 min |
| Brown County | 25,800 | $69K | $191K | 79% | 25% | 87% | 16 min |
| Carlton County | 36,518 | $81K | $245K | 80% | 27% | 88% | 23 min |
| Carver County | 110,041 | $126K | $454K | 82% | 50% | 95% | 27 min |
| Cass County | 30,992 | $69K | $288K | 86% | 26% | 89% | 26 min |
| Chippewa County | 12,377 | $71K | $156K | 72% | 19% | 88% | 18 min |
| Chisago County | 57,991 | $99K | $352K | 86% | 24% | 93% | 33 min |
| Clay County | 66,059 | $81K | $266K | 66% | 39% | 90% | 21 min |
| Clearwater County | 8,616 | $64K | $192K | 80% | 20% | 85% | 27 min |
| Cook County | 5,635 | $73K | $336K | 78% | 47% | 93% | 18 min |
| Cottonwood County | 11,458 | $73K | $169K | 74% | 24% | 85% | 17 min |
| Crow Wing County | 67,686 | $73K | $307K | 77% | 29% | 90% | 24 min |
| Dakota County | 445,771 | $106K | $381K | 75% | 45% | 94% | 25 min |
| Dodge County | 21,045 | $96K | $288K | 87% | 30% | 91% | 27 min |
| Douglas County | 39,575 | $79K | $321K | 77% | 30% | 89% | 21 min |
| Faribault County | 13,914 | $67K | $135K | 79% | 22% | 85% | 21 min |
| Fillmore County | 21,414 | $78K | $221K | 83% | 24% | 87% | 28 min |
| Freeborn County | 30,623 | $71K | $171K | 80% | 18% | 86% | 21 min |
| Goodhue County | 47,943 | $84K | $285K | 79% | 28% | 91% | 25 min |
| Grant County | 6,127 | $74K | $191K | 79% | 21% | 89% | 25 min |
| Hennepin County | 1,269,496 | $98K | $393K | 63% | 54% | 93% | 24 min |
| Houston County | 18,653 | $80K | $239K | 83% | 30% | 88% | 25 min |
| Hubbard County | 21,831 | $72K | $283K | 83% | 31% | 89% | 24 min |
| Isanti County | 42,596 | $87K | $306K | 84% | 21% | 91% | 34 min |
| Itasca County | 45,275 | $69K | $225K | 83% | 26% | 89% | 25 min |
| Jackson County | 9,933 | $76K | $157K | 80% | 26% | 89% | 20 min |
| Kanabec County | 16,390 | $71K | $228K | 85% | 16% | 85% | 37 min |
| Kandiyohi County | 44,079 | $77K | $243K | 73% | 28% | 89% | 19 min |
| Kittson County | 4,084 | $76K | $135K | 83% | 29% | 89% | 21 min |
| Koochiching County | 11,833 | $67K | $157K | 80% | 22% | 89% | 18 min |
| Lac qui Parle County | 6,682 | $74K | $158K | 83% | 23% | 85% | 18 min |
| Lake County | 10,879 | $76K | $241K | 84% | 27% | 88% | 27 min |
| Lake of the Woods County | 3,821 | $78K | $216K | 82% | 25% | 91% | 18 min |
| Le Sueur County | 29,113 | $95K | $317K | 81% | 26% | 89% | 27 min |
| Lincoln County | 5,603 | $70K | $164K | 81% | 26% | 88% | 23 min |
| Lyon County | 25,503 | $75K | $201K | 73% | 31% | 91% | 16 min |
| Mahnomen County | 5,358 | $59K | $162K | 73% | 16% | 86% | 22 min |
| Marshall County | 8,909 | $73K | $165K | 83% | 19% | 87% | 25 min |
| Martin County | 19,780 | $60K | $164K | 69% | 24% | 86% | 18 min |
| McLeod County | 36,798 | $80K | $246K | 77% | 20% | 89% | 25 min |
| Meeker County | 23,468 | $75K | $249K | 79% | 20% | 88% | 27 min |
| Mille Lacs County | 27,125 | $73K | $258K | 78% | 18% | 87% | 34 min |
| Morrison County | 34,249 | $69K | $249K | 81% | 19% | 87% | 30 min |
| Mower County | 40,343 | $73K | $185K | 78% | 24% | 88% | 22 min |
| Murray County | 8,097 | $74K | $185K | 82% | 24% | 85% | 22 min |
| Nicollet County | 34,411 | $80K | $270K | 72% | 36% | 89% | 18 min |
| Nobles County | 22,041 | $66K | $197K | 74% | 18% | 88% | 20 min |
| Norman County | 6,367 | $72K | $147K | 79% | 23% | 88% | 25 min |
| Olmsted County | 164,498 | $95K | $332K | 71% | 49% | 92% | 20 min |
| Otter Tail County | 60,475 | $72K | $273K | 80% | 28% | 88% | 22 min |
| Pennington County | 13,791 | $77K | $196K | 72% | 21% | 88% | 14 min |
| Pine County | 29,640 | $71K | $239K | 82% | 17% | 86% | 34 min |
| Pipestone County | 9,284 | $70K | $140K | 81% | 22% | 88% | 18 min |
| Polk County | 30,705 | $73K | $223K | 71% | 28% | 90% | 20 min |
| Pope County | 11,418 | $76K | $255K | 84% | 24% | 88% | 24 min |
| Ramsey County | 542,945 | $82K | $327K | 61% | 46% | 92% | 23 min |
| Red Lake County | 3,915 | $77K | $162K | 83% | 19% | 83% | 26 min |
| Redwood County | 15,350 | $68K | $158K | 78% | 22% | 87% | 19 min |
| Renville County | 14,558 | $71K | $163K | 80% | 18% | 86% | 22 min |
| Rice County | 67,917 | $83K | $320K | 76% | 30% | 92% | 24 min |
| Rock County | 9,621 | $71K | $224K | 77% | 26% | 90% | 21 min |
| Roseau County | 15,302 | $74K | $184K | 79% | 21% | 90% | 18 min |
| Scott County | 154,557 | $119K | $419K | 84% | 44% | 95% | 26 min |
| Sherburne County | 100,560 | $105K | $361K | 83% | 30% | 93% | 33 min |
| Sibley County | 15,005 | $78K | $232K | 81% | 19% | 88% | 29 min |
| St. Louis County | 200,123 | $70K | $221K | 71% | 34% | 89% | 21 min |
| Stearns County | 160,865 | $77K | $273K | 68% | 29% | 91% | 23 min |
| Steele County | 37,439 | $84K | $245K | 79% | 28% | 88% | 21 min |
| Stevens County | 9,739 | $76K | $203K | 63% | 31% | 91% | 16 min |
| Swift County | 9,748 | $60K | $161K | 72% | 24% | 84% | 21 min |
| Todd County | 25,575 | $68K | $208K | 83% | 16% | 83% | 27 min |
| Traverse County | 3,243 | $63K | $114K | 82% | 17% | 84% | 18 min |
| Wabasha County | 21,565 | $82K | $264K | 83% | 27% | 86% | 26 min |
| Wadena County | 14,256 | $61K | $173K | 74% | 20% | 85% | 22 min |
| Waseca County | 18,885 | $76K | $221K | 81% | 21% | 88% | 24 min |
| Washington County | 276,238 | $115K | $422K | 81% | 49% | 95% | 26 min |
| Watonwan County | 11,205 | $72K | $162K | 78% | 17% | 84% | 24 min |
| Wilkin County | 6,371 | $71K | $182K | 80% | 23% | 85% | 23 min |
| Winona County | 49,779 | $71K | $235K | 70% | 33% | 91% | 19 min |
| Wright County | 148,269 | $107K | $359K | 84% | 34% | 93% | 32 min |
| Yellow Medicine County | 9,451 | $74K | $155K | 84% | 20% | 86% | 22 min |
Source: U.S. Census Bureau, American Community Survey 2020–2024 5-year estimates
People.
5,739,445 residents in 2,307,955 households, next to the United States figure.
Source: U.S. Census Bureau, American Community Survey 2020–2024 5-year estimates
Homes.
2,545,030 housing units; the median owner-occupied home is valued at $329,300 (±$903).
When homes were built
Source: U.S. Census Bureau, American Community Survey 2020–2024 5-year estimates
Income and work.
Household income and work, in 2024 dollars; median household income ±$409.
The poverty rate uses the federal poverty thresholds, which vary with family size. It says nothing on its own about what a neighborhood is like to live in.
Source: U.S. Census Bureau, American Community Survey 2020–2024 5-year estimates
Getting around.
How workers aged 16 and over get to work, and how long it takes.
Source: U.S. Census Bureau, American Community Survey 2020–2024 5-year estimates
Internet.
Home internet subscriptions.
American Community Survey figures are estimates from a rolling sample, averaged over 2020–2024. Each comes with a margin of error, which is wider in places with fewer people.
Source: U.S. Census Bureau, American Community Survey 2020–2024 5-year estimates
Counties in Minnesota.
Every county has its own page, with all of its ZIP codes.