Texas
Texas has 30,188,424 residents in 254 counties and 1,817 ZIP codes. The median household income is $78,476, in line with the national figure, and the typical owner-occupied home is valued at $283,800. 63% of households own their home.
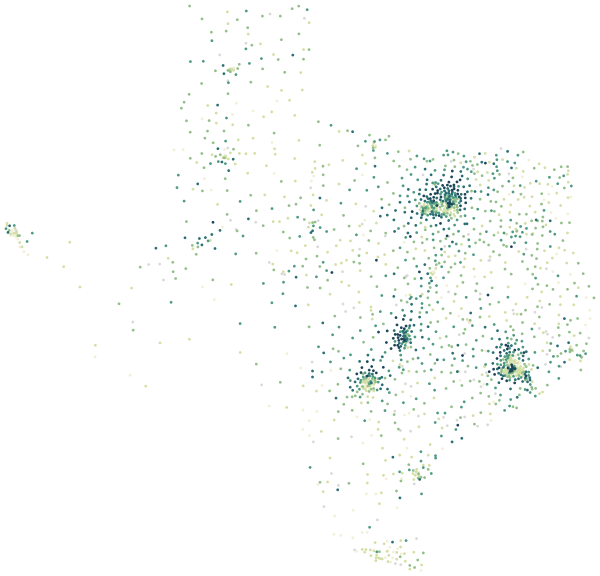
Sources: U.S. Census Bureau, American Community Survey 2020–2024 5-year estimates · U.S. Census Bureau, 2024 Gazetteer and 2020 ZCTA relationship files
All 254 counties.
Colour shows where each county sits among the others in the table, from lowest to highest.
| County | Residents | Household income | Home value | Owners | Bachelor's+ | Broadband | Commute |
|---|---|---|---|---|---|---|---|
| Anderson County | 58,439 | $62K | $185K | 72% | 15% | 88% | 25 min |
| Andrews County | 18,610 | $72K | $196K | 79% | 18% | 89% | 25 min |
| Angelina County | 87,275 | $61K | $164K | 64% | 18% | 91% | 22 min |
| Aransas County | 24,876 | $69K | $265K | 77% | 29% | 90% | 22 min |
| Archer County | 8,867 | $72K | $189K | 85% | 25% | 89% | 24 min |
| Armstrong County | 1,822 | $73K | $172K | 80% | 27% | 93% | 26 min |
| Atascosa County | 51,008 | $71K | $175K | 77% | 16% | 82% | 31 min |
| Austin County | 31,170 | $76K | $297K | 77% | 25% | 78% | 31 min |
| Bailey County | 6,913 | $61K | $105K | 80% | 15% | 84% | 21 min |
| Bandera County | 22,021 | $76K | $278K | 86% | 27% | 90% | 43 min |
| Bastrop County | 106,582 | $86K | $315K | 77% | 25% | 91% | 38 min |
| Baylor County | 3,485 | $45K | $103K | 66% | 25% | 84% | 17 min |
| Bee County | 31,083 | $58K | $111K | 71% | 14% | 82% | 23 min |
| Bell County | 386,897 | $69K | $241K | 57% | 27% | 91% | 26 min |
| Bexar County | 2,067,341 | $72K | $262K | 59% | 32% | 92% | 28 min |
| Blanco County | 12,446 | $92K | $484K | 76% | 35% | 89% | 31 min |
| Borden County | 713 | $66K | $109K | 66% | 37% | 86% | 16 min |
| Bosque County | 18,687 | $69K | $201K | 76% | 20% | 82% | 30 min |
| Bowie County | 92,115 | $60K | $173K | 63% | 24% | 83% | 20 min |
| Brazoria County | 391,255 | $98K | $302K | 74% | 33% | 94% | 33 min |
| Brazos County | 242,311 | $59K | $296K | 47% | 43% | 86% | 20 min |
| Brewster County | 9,503 | $56K | $227K | 63% | 46% | 84% | 16 min |
| Briscoe County | 1,301 | $45K | $90K | 83% | 23% | 73% | 27 min |
| Brooks County | 6,943 | $48K | $81K | 53% | 17% | 79% | 18 min |
| Brown County | 38,347 | $57K | $159K | 68% | 20% | 87% | 20 min |
| Burleson County | 18,857 | $70K | $191K | 82% | 24% | 83% | 31 min |
| Burnet County | 52,652 | $79K | $344K | 76% | 29% | 92% | 31 min |
| Caldwell County | 48,669 | $70K | $241K | 75% | 19% | 90% | 37 min |
| Calhoun County | 19,868 | $80K | $171K | 77% | 20% | 86% | 21 min |
| Callahan County | 14,241 | $72K | $146K | 81% | 24% | 90% | 27 min |
| Cameron County | 426,120 | $53K | $137K | 65% | 22% | 84% | 23 min |
| Camp County | 12,798 | $59K | $173K | 78% | 22% | 87% | 23 min |
| Carson County | 5,801 | $85K | $143K | 79% | 26% | 84% | 26 min |
| Cass County | 28,568 | $54K | $146K | 77% | 19% | 80% | 27 min |
| Castro County | 7,344 | $57K | $95K | 64% | 19% | 85% | 17 min |
| Chambers County | 51,498 | $110K | $330K | 82% | 22% | 91% | 35 min |
| Cherokee County | 51,886 | $61K | $169K | 74% | 19% | 84% | 28 min |
| Childress County | 6,743 | $59K | $125K | 71% | 12% | 84% | 25 min |
| Clay County | 10,495 | $80K | $172K | 84% | 22% | 88% | 30 min |
| Cochran County | 2,550 | $45K | $53K | 65% | 8% | 80% | 26 min |
| Coke County | 3,353 | $43K | $118K | 71% | 23% | 88% | 27 min |
| Coleman County | 7,833 | $49K | $93K | 77% | 17% | 87% | 29 min |
| Collin County | 1,163,337 | $122K | $476K | 65% | 56% | 97% | 30 min |
| Collingsworth County | 2,588 | $61K | $104K | 74% | 26% | 86% | 15 min |
| Colorado County | 21,006 | $66K | $210K | 80% | 23% | 82% | 27 min |
| Comal County | 183,826 | $102K | $427K | 77% | 43% | 95% | 32 min |
| Comanche County | 13,950 | $60K | $156K | 80% | 21% | 87% | 22 min |
| Concho County | 3,328 | $66K | $107K | 81% | 14% | 83% | 20 min |
| Cooke County | 43,046 | $74K | $240K | 72% | 24% | 86% | 28 min |
| Coryell County | 84,748 | $71K | $195K | 59% | 19% | 91% | 26 min |
| Cottle County | 1,368 | $59K | $59K | 83% | 21% | 73% | 18 min |
| Crane County | 4,610 | $62K | $129K | 84% | 13% | 83% | 27 min |
| Crockett County | 2,822 | $81K | – | 74% | 11% | 87% | 21 min |
| Crosby County | 5,041 | $52K | $81K | 69% | 15% | 88% | 28 min |
| Culberson County | 2,195 | $59K | $79K | 70% | 16% | 74% | 17 min |
| Dallam County | 7,298 | $72K | $151K | 64% | 12% | 85% | 17 min |
| Dallas County | 2,621,179 | $77K | $303K | 51% | 36% | 92% | 29 min |
| Dawson County | 12,134 | $54K | $103K | 71% | 13% | 84% | 27 min |
| DeWitt County | 20,016 | $64K | $171K | 74% | 17% | 79% | 25 min |
| Deaf Smith County | 18,460 | $61K | $121K | 67% | 11% | 80% | 19 min |
| Delta County | 5,438 | $67K | $164K | 83% | 15% | 84% | 30 min |
| Denton County | 979,561 | $111K | $437K | 66% | 49% | 96% | 30 min |
| Dickens County | 1,747 | $49K | $65K | 80% | 18% | 86% | 26 min |
| Dimmit County | 8,380 | $39K | $86K | 67% | 10% | 74% | 25 min |
| Donley County | 3,257 | $59K | $96K | 75% | 17% | 75% | 22 min |
| Duval County | 9,742 | $49K | $89K | 70% | 7% | 69% | 32 min |
| Eastland County | 18,011 | $54K | $135K | 72% | 22% | 88% | 26 min |
| Ector County | 164,654 | $72K | $200K | 65% | 18% | 88% | 27 min |
| Edwards County | 1,290 | $40K | – | 88% | 26% | 69% | 19 min |
| El Paso County | 870,779 | $60K | $180K | 64% | 26% | 90% | 26 min |
| Ellis County | 213,160 | $100K | $349K | 76% | 30% | 93% | 33 min |
| Erath County | 43,794 | $65K | $269K | 63% | 32% | 90% | 22 min |
| Falls County | 17,291 | $57K | $111K | 77% | 20% | 80% | 30 min |
| Fannin County | 37,326 | $72K | $234K | 79% | 20% | 85% | 33 min |
| Fayette County | 25,042 | $76K | $294K | 79% | 28% | 81% | 24 min |
| Fisher County | 3,655 | $66K | $79K | 80% | 17% | 85% | 25 min |
| Floyd County | 5,216 | $58K | $90K | 73% | 15% | 78% | 18 min |
| Foard County | 991 | $62K | $71K | 76% | 21% | 66% | 18 min |
| Fort Bend County | 893,767 | $114K | $375K | 77% | 50% | 96% | 35 min |
| Franklin County | 10,632 | $72K | $226K | 82% | 28% | 90% | 25 min |
| Freestone County | 20,049 | $60K | $168K | 75% | 17% | 82% | 26 min |
| Frio County | 18,582 | $66K | $108K | 59% | 12% | 77% | 22 min |
| Gaines County | 22,232 | $74K | $201K | 75% | 12% | 84% | 28 min |
| Galveston County | 358,990 | $86K | $315K | 68% | 35% | 93% | 30 min |
| Garza County | 5,118 | $46K | $78K | 71% | 10% | 85% | 25 min |
| Gillespie County | 27,524 | $76K | $461K | 75% | 37% | 89% | 23 min |
| Glasscock County | 1,068 | $101K | $245K | 69% | 29% | 87% | 26 min |
| Goliad County | 7,141 | $59K | $193K | 87% | 21% | 80% | 32 min |
| Gonzales County | 19,851 | $59K | $159K | 66% | 12% | 87% | 28 min |
| Gray County | 21,045 | $60K | $103K | 76% | 16% | 88% | 20 min |
| Grayson County | 143,337 | $72K | $248K | 67% | 24% | 90% | 27 min |
| Gregg County | 125,480 | $67K | $203K | 60% | 23% | 89% | 22 min |
| Grimes County | 31,340 | $70K | $237K | 80% | 20% | 84% | 38 min |
| Guadalupe County | 183,642 | $92K | $304K | 78% | 31% | 94% | 31 min |
| Hale County | 32,131 | $52K | $117K | 61% | 15% | 82% | 21 min |
| Hall County | 2,820 | $48K | $86K | 74% | 21% | 81% | 16 min |
| Hamilton County | 8,406 | $58K | $148K | 79% | 27% | 85% | 20 min |
| Hansford County | 5,119 | $69K | $125K | 81% | 36% | 90% | 20 min |
| Hardeman County | 3,501 | $63K | $82K | 74% | 17% | 80% | 16 min |
| Hardin County | 57,642 | $76K | $206K | 82% | 21% | 86% | 32 min |
| Harris County | 4,838,303 | $75K | $277K | 55% | 34% | 92% | 32 min |
| Harrison County | 70,155 | $66K | $180K | 77% | 23% | 85% | 23 min |
| Hartley County | 5,215 | $76K | $263K | 74% | 21% | 94% | 14 min |
| Haskell County | 5,421 | $61K | $99K | 74% | 23% | 87% | 18 min |
| Hays County | 268,638 | $89K | $400K | 64% | 43% | 93% | 34 min |
| Hemphill County | 3,234 | $62K | $206K | 71% | 22% | 78% | 19 min |
| Henderson County | 84,862 | $65K | $211K | 78% | 21% | 86% | 31 min |
| Hidalgo County | 891,977 | $54K | $141K | 68% | 21% | 88% | 24 min |
| Hill County | 37,328 | $65K | $179K | 78% | 18% | 88% | 34 min |
| Hockley County | 21,363 | $63K | $127K | 72% | 19% | 85% | 24 min |
| Hood County | 65,894 | $88K | $306K | 81% | 33% | 93% | 35 min |
| Hopkins County | 37,784 | $71K | $221K | 71% | 22% | 91% | 24 min |
| Houston County | 22,051 | $57K | $165K | 71% | 15% | 82% | 29 min |
| Howard County | 32,290 | $70K | $156K | 70% | 16% | 86% | 23 min |
| Hudspeth County | 3,403 | $49K | $64K | 74% | 10% | 86% | 30 min |
| Hunt County | 108,972 | $72K | $242K | 71% | 23% | 89% | 33 min |
| Hutchinson County | 20,184 | $67K | $119K | 83% | 17% | 89% | 22 min |
| Irion County | 1,409 | $70K | $204K | 83% | 28% | 81% | 30 min |
| Jack County | 8,882 | $68K | $251K | 72% | 15% | 88% | 30 min |
| Jackson County | 15,152 | $65K | $204K | 71% | 17% | 84% | 28 min |
| Jasper County | 32,727 | $57K | $136K | 79% | 14% | 91% | 30 min |
| Jeff Davis County | 1,865 | $59K | $226K | 88% | 36% | 87% | 18 min |
| Jefferson County | 253,878 | $60K | $170K | 63% | 20% | 90% | 23 min |
| Jim Hogg County | 4,727 | $42K | $129K | 56% | 15% | 76% | 24 min |
| Jim Wells County | 38,850 | $52K | $124K | 69% | 16% | 76% | 27 min |
| Johnson County | 195,597 | $85K | $286K | 75% | 25% | 92% | 34 min |
| Jones County | 20,304 | $59K | $97K | 80% | 12% | 82% | 26 min |
| Karnes County | 14,968 | $60K | $149K | 62% | 14% | 71% | 23 min |
| Kaufman County | 172,604 | $89K | $321K | 78% | 27% | 91% | 39 min |
| Kendall County | 48,567 | $115K | $513K | 80% | 49% | 94% | 30 min |
| Kenedy County | 145 | $39K | – | 53% | 13% | 69% | 28 min |
| Kent County | 734 | $73K | $122K | 79% | 26% | 90% | 16 min |
| Kerr County | 53,489 | $69K | $321K | 70% | 31% | 91% | 23 min |
| Kimble County | 4,389 | $69K | $201K | 79% | 27% | 85% | 24 min |
| King County | 211 | $47K | $52K | 60% | 39% | 100% | 15 min |
| Kinney County | 3,157 | $70K | $82K | 84% | 12% | 70% | 17 min |
| Kleberg County | 30,579 | $61K | $161K | 53% | 23% | 86% | 22 min |
| Knox County | 3,307 | $57K | $77K | 77% | 14% | 87% | 17 min |
| La Salle County | 6,839 | $58K | $98K | 76% | 12% | 85% | 18 min |
| Lamar County | 50,669 | $62K | $201K | 66% | 22% | 84% | 21 min |
| Lamb County | 12,828 | $61K | $82K | 74% | 14% | 85% | 18 min |
| Lampasas County | 22,715 | $82K | $250K | 80% | 24% | 92% | 31 min |
| Lavaca County | 20,552 | $63K | $228K | 78% | 22% | 82% | 27 min |
| Lee County | 17,971 | $76K | $268K | 78% | 21% | 85% | 35 min |
| Leon County | 16,263 | $61K | $186K | 77% | 19% | 82% | 31 min |
| Liberty County | 103,380 | $69K | $182K | 82% | 12% | 90% | 43 min |
| Limestone County | 22,283 | $61K | $164K | 72% | 19% | 81% | 29 min |
| Lipscomb County | 2,918 | $73K | $124K | 82% | 22% | 87% | 21 min |
| Live Oak County | 11,620 | $57K | $159K | 71% | 16% | 77% | 28 min |
| Llano County | 22,424 | $68K | $357K | 77% | 32% | 89% | 28 min |
| Loving County | 33 | $51K | – | 11% | 0% | 93% | 4 min |
| Lubbock County | 318,884 | $64K | $214K | 56% | 33% | 89% | 18 min |
| Lynn County | 5,752 | $74K | $147K | 77% | 27% | 89% | 25 min |
| Madison County | 13,648 | $75K | $176K | 75% | 18% | 88% | 30 min |
| Marion County | 9,737 | $50K | $102K | 79% | 16% | 74% | 35 min |
| Martin County | 5,218 | $94K | $175K | 78% | 21% | 83% | 23 min |
| Mason County | 3,955 | $74K | $294K | 80% | 39% | 88% | 30 min |
| Matagorda County | 36,329 | $59K | $173K | 68% | 22% | 86% | 26 min |
| Maverick County | 58,082 | $50K | $159K | 71% | 14% | 81% | 22 min |
| McCulloch County | 7,514 | $54K | $151K | 67% | 24% | 92% | 22 min |
| McLennan County | 266,067 | $67K | $244K | 62% | 29% | 90% | 22 min |
| McMullen County | 700 | $44K | $97K | 78% | 20% | 81% | 21 min |
| Medina County | 53,547 | $78K | $240K | 84% | 23% | 89% | 34 min |
| Menard County | 1,955 | $53K | $109K | 81% | 24% | 77% | 20 min |
| Midland County | 174,801 | $93K | $313K | 68% | 31% | 92% | 23 min |
| Milam County | 25,567 | $66K | $190K | 77% | 21% | 84% | 34 min |
| Mills County | 4,511 | $68K | $224K | 80% | 28% | 90% | 26 min |
| Mitchell County | 9,018 | $61K | $86K | 79% | 12% | 84% | 25 min |
| Montague County | 21,046 | $65K | $206K | 80% | 19% | 81% | 36 min |
| Montgomery County | 684,432 | $98K | $346K | 72% | 39% | 95% | 35 min |
| Moore County | 21,373 | $62K | $153K | 63% | 12% | 84% | 20 min |
| Morris County | 12,076 | $59K | $120K | 74% | 16% | 87% | 27 min |
| Motley County | 1,183 | $61K | $88K | 77% | 19% | 80% | 19 min |
| Nacogdoches County | 65,162 | $54K | $169K | 59% | 28% | 87% | 21 min |
| Navarro County | 54,711 | $63K | $173K | 69% | 18% | 85% | 29 min |
| Newton County | 12,093 | $43K | $103K | 83% | 7% | 91% | 39 min |
| Nolan County | 14,454 | $51K | $96K | 68% | 16% | 83% | 19 min |
| Nueces County | 352,955 | $67K | $209K | 60% | 24% | 89% | 23 min |
| Ochiltree County | 9,786 | $70K | $134K | 73% | 21% | 90% | 19 min |
| Oldham County | 2,249 | $80K | $163K | 74% | 21% | 92% | 29 min |
| Orange County | 85,307 | $72K | $173K | 75% | 18% | 91% | 27 min |
| Palo Pinto County | 29,295 | $68K | $198K | 71% | 18% | 90% | 29 min |
| Panola County | 22,726 | $65K | $158K | 80% | 17% | 85% | 30 min |
| Parker County | 165,168 | $104K | $376K | 81% | 32% | 95% | 34 min |
| Parmer County | 9,731 | $70K | $147K | 72% | 17% | 91% | 18 min |
| Pecos County | 14,896 | $73K | $166K | 72% | 14% | 85% | 22 min |
| Polk County | 52,800 | $62K | $185K | 78% | 16% | 88% | 31 min |
| Potter County | 115,975 | $53K | $147K | 57% | 19% | 86% | 23 min |
| Presidio County | 5,930 | $44K | $121K | 77% | 28% | 80% | 11 min |
| Rains County | 12,775 | $65K | $241K | 83% | 21% | 92% | 38 min |
| Randall County | 146,070 | $84K | $239K | 68% | 34% | 92% | 21 min |
| Reagan County | 3,232 | $58K | $172K | 70% | 14% | 80% | 22 min |
| Real County | 2,802 | $40K | $113K | 78% | 21% | 78% | 23 min |
| Red River County | 11,611 | $48K | $122K | 72% | 15% | 77% | 32 min |
| Reeves County | 12,664 | $64K | $118K | 74% | 7% | 75% | 20 min |
| Refugio County | 6,707 | $60K | $99K | 77% | 14% | 85% | 27 min |
| Roberts County | 832 | $68K | $162K | 85% | 21% | 81% | 21 min |
| Robertson County | 17,167 | $72K | $186K | 72% | 22% | 84% | 26 min |
| Rockwall County | 123,617 | $128K | $416K | 83% | 45% | 97% | 37 min |
| Runnels County | 9,874 | $63K | $109K | 75% | 19% | 88% | 27 min |
| Rusk County | 52,842 | $69K | $171K | 79% | 18% | 80% | 28 min |
| Sabine County | 10,023 | $67K | $153K | 86% | 14% | 86% | 30 min |
| San Augustine County | 7,874 | $50K | $100K | 75% | 14% | 81% | 31 min |
| San Jacinto County | 28,441 | $65K | $209K | 85% | 16% | 85% | 44 min |
| San Patricio County | 70,181 | $70K | $192K | 67% | 18% | 84% | 25 min |
| San Saba County | 5,696 | $56K | $169K | 72% | 24% | 90% | 27 min |
| Schleicher County | 2,381 | $87K | $123K | 84% | 18% | 72% | 33 min |
| Scurry County | 16,488 | $60K | $114K | 77% | 13% | 84% | 21 min |
| Shackelford County | 3,175 | $73K | $175K | 79% | 34% | 87% | 25 min |
| Shelby County | 24,155 | $50K | $102K | 74% | 15% | 82% | 26 min |
| Sherman County | 2,295 | $61K | $147K | 76% | 30% | 97% | 20 min |
| Smith County | 241,740 | $74K | $241K | 69% | 29% | 91% | 25 min |
| Somervell County | 9,691 | $80K | $290K | 80% | 29% | 91% | 28 min |
| Starr County | 66,067 | $38K | $95K | 70% | 14% | 79% | 24 min |
| Stephens County | 9,351 | $58K | $110K | 79% | 17% | 86% | 28 min |
| Sterling County | 1,468 | $65K | $147K | 78% | 25% | 91% | 25 min |
| Stonewall County | 1,227 | $57K | $49K | 85% | 17% | 95% | 18 min |
| Sutton County | 3,277 | $79K | $156K | 76% | 18% | 85% | 25 min |
| Swisher County | 6,937 | $36K | $86K | 66% | 16% | 73% | 22 min |
| Tarrant County | 2,167,390 | $84K | $324K | 59% | 35% | 93% | 29 min |
| Taylor County | 145,863 | $67K | $199K | 61% | 29% | 92% | 18 min |
| Terrell County | 835 | $45K | $138K | 89% | 27% | 82% | 13 min |
| Terry County | 11,629 | $44K | $105K | 67% | 10% | 89% | 24 min |
| Throckmorton County | 1,639 | $59K | $90K | 68% | 22% | 91% | 17 min |
| Titus County | 31,363 | $58K | $174K | 71% | 16% | 85% | 21 min |
| Tom Green County | 119,577 | $68K | $197K | 65% | 26% | 88% | 21 min |
| Travis County | 1,330,015 | $100K | $523K | 52% | 57% | 94% | 27 min |
| Trinity County | 14,046 | $52K | $120K | 79% | 17% | 85% | 39 min |
| Tyler County | 20,238 | $55K | $157K | 81% | 12% | 85% | 36 min |
| Upshur County | 42,567 | $66K | $168K | 81% | 18% | 88% | 31 min |
| Upton County | 3,191 | $49K | $109K | 77% | 9% | 75% | 32 min |
| Uvalde County | 24,881 | $54K | $151K | 71% | 20% | 85% | 20 min |
| Val Verde County | 47,741 | $66K | $165K | 69% | 23% | 86% | 20 min |
| Van Zandt County | 62,649 | $69K | $222K | 82% | 20% | 85% | 39 min |
| Victoria County | 91,413 | $71K | $210K | 65% | 20% | 82% | 23 min |
| Walker County | 80,209 | $52K | $227K | 57% | 22% | 86% | 28 min |
| Waller County | 61,552 | $80K | $319K | 72% | 28% | 90% | 35 min |
| Ward County | 11,144 | $66K | $151K | 79% | 12% | 89% | 24 min |
| Washington County | 36,647 | $78K | $288K | 70% | 31% | 85% | 25 min |
| Webb County | 269,294 | $63K | $190K | 65% | 21% | 87% | 24 min |
| Wharton County | 41,794 | $67K | $190K | 72% | 21% | 82% | 28 min |
| Wheeler County | 4,862 | $60K | $106K | 76% | 17% | 89% | 25 min |
| Wichita County | 129,996 | $64K | $154K | 61% | 25% | 89% | 16 min |
| Wilbarger County | 12,616 | $54K | $89K | 67% | 17% | 84% | 15 min |
| Willacy County | 20,139 | $54K | $74K | 75% | 14% | 82% | 21 min |
| Williamson County | 672,688 | $111K | $447K | 66% | 48% | 96% | 30 min |
| Wilson County | 52,781 | $95K | $321K | 85% | 26% | 88% | 37 min |
| Winkler County | 7,454 | $87K | $148K | 86% | 11% | 88% | 31 min |
| Wise County | 75,005 | $93K | $305K | 81% | 22% | 90% | 36 min |
| Wood County | 46,961 | $60K | $217K | 80% | 22% | 88% | 31 min |
| Yoakum County | 7,571 | $85K | $183K | 67% | 20% | 96% | 28 min |
| Young County | 18,029 | $68K | $176K | 74% | 24% | 91% | 18 min |
| Zapata County | 13,841 | $39K | $97K | 72% | 15% | 79% | 24 min |
| Zavala County | 9,412 | $37K | $99K | 69% | 11% | 83% | 22 min |
Source: U.S. Census Bureau, American Community Survey 2020–2024 5-year estimates
People.
30,188,424 residents in 10,992,816 households, next to the United States figure.
Source: U.S. Census Bureau, American Community Survey 2020–2024 5-year estimates
Homes.
12,128,515 housing units; the median owner-occupied home is valued at $283,800 (±$738).
When homes were built
Source: U.S. Census Bureau, American Community Survey 2020–2024 5-year estimates
Income and work.
Household income and work, in 2024 dollars; median household income ±$263.
The poverty rate uses the federal poverty thresholds, which vary with family size. It says nothing on its own about what a neighborhood is like to live in.
Source: U.S. Census Bureau, American Community Survey 2020–2024 5-year estimates
Getting around.
How workers aged 16 and over get to work, and how long it takes.
Source: U.S. Census Bureau, American Community Survey 2020–2024 5-year estimates
Internet.
Home internet subscriptions.
American Community Survey figures are estimates from a rolling sample, averaged over 2020–2024. Each comes with a margin of error, which is wider in places with fewer people.
Source: U.S. Census Bureau, American Community Survey 2020–2024 5-year estimates
Counties in Texas.
Every county has its own page, with all of its ZIP codes.