Lindevang parish
Lindevang parish (Frederiksberg) had 14,243 residents on 1 January 2026, with an average age of 40.3. 64% of residents aged 15 and over were in work, in line with the municipal average. From the parish church, 398 everyday shops and services are within a 15-minute walk. The population has grown by 1.5% since 2016.
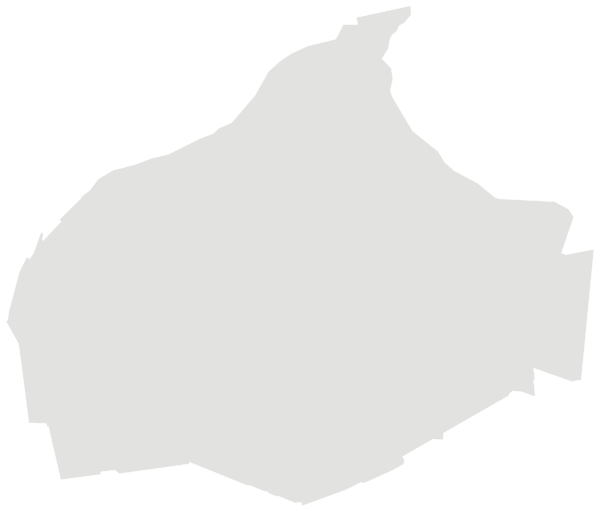
Sources: Own calculations based on figures from Statistics Denmark (StatBank) · © OpenStreetMap contributors (ODbL); municipal and regional boundaries from OpenStreetMap
People.
Age on 1 January 2026, next to the figure for Frederiksberg.
Population on 1 January
Parishes (sogne) are the smallest fixed areas for which Statistics Denmark publishes population figures. Parish boundaries cannot be downloaded as open data without registering, so the map shows the municipality with the parish church marked.
Source: Own calculations based on figures from Statistics Denmark (StatBank)
Work, income and education.
Work on 1 January 2025 and highest completed education on 1 October 2025, residents aged 15 and over.
Highest completed education
Parish unemployment comes from residents’ socio-economic status on 1 January 2025. The municipal rate is full-time unemployment averaged over 2025. The two are measured differently.
Source: Own calculations based on figures from Statistics Denmark (StatBank)
Everyday life.
398 everyday shops and services within a 15-minute walk of the parish church; 10% green space within 500 metres.
Shops and services are counted within 1.2 km in a straight line from the parish church, green space within 500 metres. Municipal and regional figures are averages weighted by population.
Source: © OpenStreetMap contributors (ODbL); municipal and regional boundaries from OpenStreetMap. Within one kilometre.
The parish and its neighbours.
Lindevang and the nearest parishes in Frederiksberg, side by side. Colour shows where each sits among the others in the table.
| Parish | Residents | 65+ | Under 18 | Avg. age | In work | Master’s level | Green 500 m | Services 15 min |
|---|---|---|---|---|---|---|---|---|
| Flintholm | 10,501 | 27% | 14% | 46.0 | 54% | 19% | 16% | 393 |
| Frederiksberg | 16,377 | 20% | 17% | 43.0 | 65% | 33% | 65% | 490 |
| Godthaabs | 11,752 | 21% | 16% | 42.1 | 67% | 33% | 9% | 473 |
| Lindevang | 14,243 | 17% | 15% | 40.3 | 64% | 23% | 10% | 398 |
| Mariendals | 14,995 | 15% | 17% | 38.5 | 68% | 32% | 10% | 513 |
| Sankt Lukas | 7,062 | 11% | 15% | 37.6 | 73% | 31% | 14% | 585 |
| Sankt Markus | 11,294 | 18% | 18% | 41.6 | 67% | 33% | 6% | 995 |
| Sankt Thomas | 10,181 | 12% | 17% | 37.1 | 70% | 33% | 12% | 675 |
| Solbjerg | 9,315 | 17% | 16% | 40.5 | 69% | 31% | 20% | 517 |
Sources: Own calculations based on figures from Statistics Denmark (StatBank) · © OpenStreetMap contributors (ODbL); municipal and regional boundaries from OpenStreetMap
More parishes in Frederiksberg.