Lom
Lom had 2,239 residents on 1 January 2026. Median household income after tax was NOK 642,600 in 2024, in line with the county level. 26% of households rented their home. The population is almost unchanged since 2020.
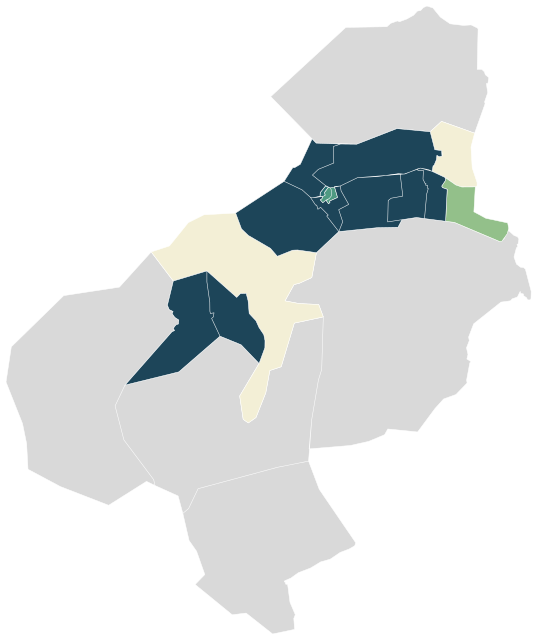
Sources: Statistics Norway (SSB), StatBank (CC BY 4.0) · © Norwegian Mapping Authority, basic statistical units (CC BY 4.0) · © OpenStreetMap contributors (ODbL)
All 15 neighbourhoods.
Colour shows where each one sits among the others in the table, from lowest to highest.
| Neighbourhood | Residents | 67+ | Under 16 | Per km² | Green 500 m | Services 15 min |
|---|---|---|---|---|---|---|
| Aukrust | 175 | 29% | 12% | 3 | 53% | 0 |
| Byre | 100 | 27% | 6% | 5 | 13% | 2 |
| Fossberg Omland | 69 | 13% | 15% | 9 | 55% | 1 |
| Frisvold | 178 | 32% | 11% | 15 | 41% | 4 |
| Frøyse | 183 | 21% | 16% | 6 | 66% | 0 |
| Galde | 71 | 27% | 17% | 2 | 43% | 1 |
| Lia | 259 | 24% | 15% | 5 | 100% | 0 |
| Lykkja | 279 | 25% | 19% | 310 | 16% | 41 |
| Medalen | 47 | 19% | 19% | 0 | 1% | 0 |
| Mo | 99 | 19% | 25% | 6 | 86% | 0 |
| Nyrnes | 51 | 6% | 28% | 2 | 0% | 0 |
| Odda | 92 | 32% | 7% | 2 | 62% | 1 |
| Prestegardsskogen | 237 | 25% | 17% | 817 | 30% | 38 |
| Ulstad | 334 | 18% | 17% | 398 | 21% | 41 |
| Vike | 71 | 37% | 14% | 5 | 46% | 3 |
Sources: Statistics Norway (SSB), StatBank (CC BY 4.0) · © OpenStreetMap contributors (ODbL)
People.
Age on 1 January 2026, next to the figure for Innlandet.
Population on 1 January
Source: Statistics Norway (SSB), StatBank (CC BY 4.0)
Income and work.
Income in 2024, employment in late 2025 and education in 2025.
Education, aged 16 and over
Income after tax is a household’s total income minus tax and negative transfers, for private households in 2024. The median is the middle value, so a few high incomes do not pull it up.
Source: Statistics Norway (SSB), StatBank (CC BY 4.0)
Homes.
1,336 homes in 2026.
Households by tenure, 2025
Homes by type of building
Source: Statistics Norway (SSB), StatBank (CC BY 4.0)
Everyday life.
16 everyday shops and services within a 15-minute walk; 44% green space within 500 metres.
Services and green space are measured from each area’s service centre: the point inside it with the most shops and services within 500 metres. District, municipal and county figures are averages weighted by population.
Source: © OpenStreetMap contributors (ODbL)
Around here.
Photographs taken near Lom, shared on Wikimedia Commons under free licences.

i


i


i

Other municipalities in Innlandet.