Namsos - Nåavmesjenjaelmie
Namsos - Nåavmesjenjaelmie had 15,112 residents on 1 January 2026. Median household income after tax was NOK 657,100 in 2024, in line with the county level. Homes sold for NOK 23,903/m² on average in 2025 (227 sales). 25% of households rented their home. The population has fallen by 0.8% since 2020.
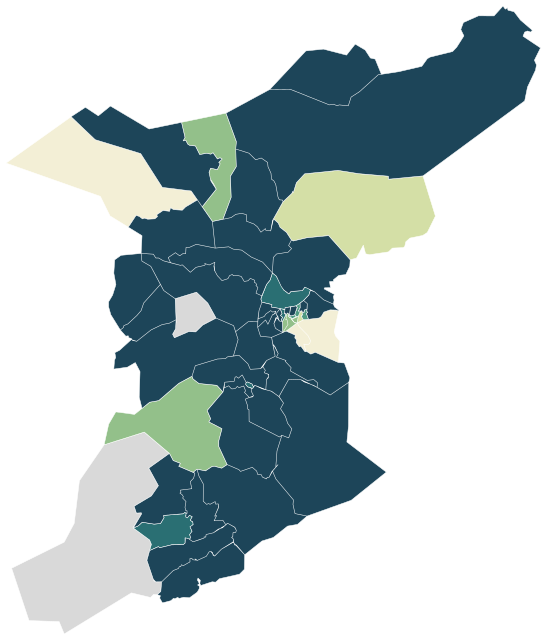
Sources: Statistics Norway (SSB), StatBank (CC BY 4.0) · © Norwegian Mapping Authority, basic statistical units (CC BY 4.0) · © OpenStreetMap contributors (ODbL)
All 51 neighbourhoods.
Colour shows where each one sits among the others in the table, from lowest to highest.
| Neighbourhood | Residents | 67+ | Under 16 | Per km² | Green 500 m | Services 15 min |
|---|---|---|---|---|---|---|
| Alte | 157 | 19% | 17% | 5 | 47% | 0 |
| Bangdalen | 198 | 19% | 20% | 1 | 61% | 1 |
| Bangsund nord | 377 | 17% | 23% | 18 | 47% | 8 |
| Bangsund syd | 310 | 16% | 22% | 1,033 | 28% | 8 |
| Bangsundstraumen | 132 | 24% | 17% | 55 | 97% | 0 |
| Bjørgan | 410 | 40% | 11% | 18 | 28% | 7 |
| Bjørum | 607 | 13% | 20% | 653 | 34% | 46 |
| Brørs | 126 | 19% | 18% | 5 | 43% | 0 |
| Buvik | 98 | 28% | 7% | 1 | 85% | 0 |
| Daltrøa | 148 | 12% | 19% | 260 | 85% | 6 |
| Elvalandet | 45 | 42% | 16% | 2 | 77% | 0 |
| Faksdal-Dun-Hov | 249 | 23% | 20% | 8 | 51% | 7 |
| Finnanger | 52 | 31% | 6% | 1 | 0% | 0 |
| Fjær | 62 | 24% | 16% | 1 | 86% | 0 |
| Flakk | 135 | 16% | 17% | 6 | 42% | 1 |
| Fossbrenna | 729 | 19% | 19% | 634 | 69% | 20 |
| Fosslandsosen | 208 | 22% | 21% | 7 | 49% | 3 |
| Guldvik | 68 | 9% | 18% | 38 | 79% | 2 |
| Guldvikmoen | 423 | 16% | 18% | 187 | 63% | 0 |
| Gullholmstrand | 648 | 9% | 25% | 549 | 63% | 18 |
| Hylla-Breivika-Husmyra 2 | 511 | 7% | 25% | 798 | 19% | 34 |
| Høyknes | 425 | 7% | 25% | 924 | 6% | 43 |
| Høyknesnes | 76 | 20% | 28% | 11 | 33% | 2 |
| Kleppen | 300 | 11% | 28% | 429 | 16% | 40 |
| Klinga | 165 | 10% | 18% | 11 | 39% | 1 |
| Lauvhammeren | 460 | 14% | 17% | 22 | 2% | 13 |
| Lavika | 777 | 26% | 11% | 1,126 | 27% | 58 |
| Ledang | 30 | 20% | 0% | 1 | 62% | 0 |
| Lund | 50 | 50% | 6% | 1 | 37% | 1 |
| Lænn-Havik | 198 | 11% | 24% | 15 | 24% | 1 |
| Midtbyen 1 | 721 | 27% | 9% | 1,949 | 13% | 52 |
| Midtbyen 2 | 687 | 41% | 8% | 680 | 14% | 55 |
| Nordsundet-Elvalandet | 56 | 29% | 13% | 2 | 35% | 0 |
| Røbergvik | 57 | 30% | 18% | 0 | 9% | 0 |
| Salsnes-Salen | 78 | 37% | 4% | 0 | 37% | 2 |
| Seierstad-Fosnesvågen | 179 | 31% | 15% | 8 | 11% | 2 |
| Selnes | 43 | 28% | 7% | 4 | 45% | 0 |
| Sjøåsen | 180 | 17% | 18% | 2 | 14% | 1 |
| Skatland | 45 | 29% | 29% | 1 | 78% | 0 |
| Skomsvoll | 250 | 25% | 16% | 6 | 50% | 2 |
| Solhaug | 189 | 25% | 14% | 5 | 59% | 0 |
| Spillum | 170 | 21% | 10% | 44 | 1% | 13 |
| Spillum-Sævik | 1,070 | 15% | 22% | 33 | 57% | 1 |
| Statland | 117 | 36% | 15% | 6 | 71% | 5 |
| Sør-Eidet | 150 | 21% | 13% | 4 | 37% | 0 |
| Sørenget | 356 | 17% | 15% | 8 | 77% | 3 |
| Vestbyen 1 | 583 | 27% | 13% | 810 | 53% | 41 |
| Vestbyen 2 | 831 | 30% | 10% | 1,187 | 34% | 52 |
| vestre Bjørum | 583 | 18% | 15% | 1,881 | 20% | 45 |
| Årgård | 115 | 23% | 17% | 3 | 51% | 5 |
| Østbyen | 464 | 20% | 16% | 1,365 | 11% | 47 |
Sources: Statistics Norway (SSB), StatBank (CC BY 4.0) · © OpenStreetMap contributors (ODbL)
People.
Age on 1 January 2026, next to the figure for Trøndelag.
Population on 1 January
Source: Statistics Norway (SSB), StatBank (CC BY 4.0)
Income and work.
Income in 2024, employment in late 2025 and education in 2025.
Education, aged 16 and over
Income after tax is a household’s total income minus tax and negative transfers, for private households in 2024. The median is the middle value, so a few high incomes do not pull it up.
Source: Statistics Norway (SSB), StatBank (CC BY 4.0)
Homes.
7,908 homes in 2026.
Households by tenure, 2025
Homes by type of building
The price per square metre is the average for homes sold in 2025, and depends on which homes happened to change hands.
Source: Statistics Norway (SSB), StatBank (CC BY 4.0)
Everyday life.
24 everyday shops and services within a 15-minute walk; 38% green space within 500 metres.
Services and green space are measured from each area’s service centre: the point inside it with the most shops and services within 500 metres. District, municipal and county figures are averages weighted by population.
Source: © OpenStreetMap contributors (ODbL)
Around here.
Photographs taken near Namsos - Nåavmesjenjaelmie, shared on Wikimedia Commons under free licences.

i


i


i

Other municipalities in Trøndelag.