Beagh
Beagh (County Galway) had 789 residents in April 2022. The median household had a gross income of €61,036, in line with the county figure. 92% of households owned their home, 6% rented privately. From an average home, 0 everyday shops and services are within a 15-minute walk.
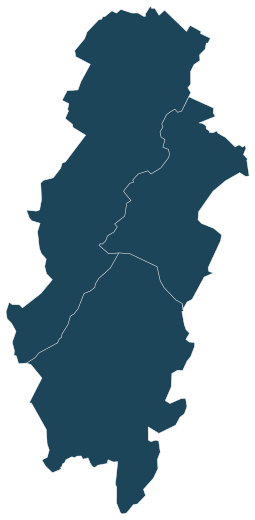
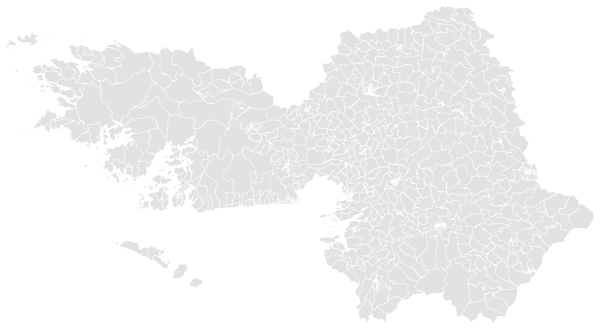

Sources: Central Statistics Office, Census 2022 Small Area Population Statistics (CC BY 4.0) · Central Statistics Office, Geographical Profiles of Income in Ireland 2022 (CC BY 4.0) · Tailte Éireann and Central Statistics Office, statistical boundaries 2022 (CC BY 4.0) · Map data © OpenStreetMap contributors (ODbL)
People.
Residents and households on census night, April 2022, next to the figure for County Galway. 274 households, 2.9 people in each on average.
Electoral divisions are the smallest legally defined areas in the State and the building blocks of local electoral areas. They vary widely in size: a rural division may have a few hundred people, a city division several thousand. Census figures here are for the usually resident population on census night, 3 April 2022.
Source: Central Statistics Office, Census 2022 Small Area Population Statistics (CC BY 4.0)
Income and work.
Household income in 2022 from the CSO’s income profiles; work and education from the 2022 Census.
Highest level of education completed
Gross household income is all income received by the household before tax and social contributions, including wages, pensions and social welfare payments; net income is after tax and contributions. The median is the middle household, so a few very high incomes do not pull it up. Figures are the CSO’s estimates from administrative records for 2022.
Sources: Central Statistics Office, Geographical Profiles of Income in Ireland 2022 (CC BY 4.0) · Central Statistics Office, Census 2022 Small Area Population Statistics (CC BY 4.0)
Homes.
319 dwellings on census night; 100% of households live in a house or bungalow and 0% in a flat or apartment.
Households by tenure, 2022
When homes were built
Median sale price, County Galway
Vacant dwellings exclude holiday homes and homes whose residents were temporarily away on census night. Median price of all residential dwellings bought in the year, from Revenue stamp duty returns, for the whole county. Prices within a county vary a great deal, and the figure depends on which homes happened to sell.
Sources: Central Statistics Office, Census 2022 Small Area Population Statistics (CC BY 4.0) · Central Statistics Office, Residential Dwelling Property Transactions, table HPA02 (CC BY 4.0)
Getting about.
How residents travel to work, school or college, and how long it takes. 6% of households have no car; 65% have two or more.
Usual way of travelling
Journey time
Sources: Central Statistics Office, Census 2022 Small Area Population Statistics (CC BY 4.0) · © OpenStreetMap contributors (ODbL)
Everyday life.
0 everyday shops and services within a 15-minute walk of an average home; 96% of the land within 500 metres is green space.
Services and green space are measured from the centre of each census small area (usually 80 to 120 homes) and averaged by population. The list of everyday places counts what lies within one kilometre of the small area with the most services in the division.
Source: © OpenStreetMap contributors (ODbL). Within one kilometre. OpenStreetMap is not complete; school counts are a guide, not the Department of Education register.
Nearby divisions.
Other electoral divisions in the same local electoral area of County Galway.