Tennessee
Tennessee has 7,066,383 residents in 95 counties and 609 ZIP codes. The median household income is $69,595, 14% below the national figure, and the typical owner-occupied home is valued at $286,700. 67% of households own their home.
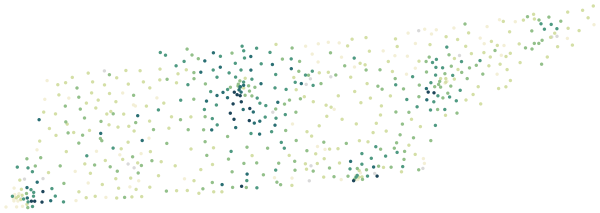
Sources: U.S. Census Bureau, American Community Survey 2020–2024 5-year estimates · U.S. Census Bureau, 2024 Gazetteer and 2020 ZCTA relationship files
All 95 counties.
Colour shows where each county sits among the others in the table, from lowest to highest.
| County | Residents | Household income | Home value | Owners | Bachelor's+ | Broadband | Commute |
|---|---|---|---|---|---|---|---|
| Anderson County | 79,153 | $66K | $239K | 72% | 28% | 90% | 26 min |
| Bedford County | 52,237 | $67K | $281K | 72% | 17% | 87% | 31 min |
| Benton County | 16,006 | $52K | $154K | 75% | 13% | 80% | 27 min |
| Bledsoe County | 15,032 | $55K | $189K | 83% | 12% | 85% | 38 min |
| Blount County | 139,333 | $77K | $321K | 77% | 29% | 90% | 27 min |
| Bradley County | 111,065 | $67K | $262K | 67% | 24% | 90% | 25 min |
| Campbell County | 39,761 | $52K | $187K | 69% | 13% | 78% | 32 min |
| Cannon County | 14,818 | $59K | $252K | 78% | 17% | 85% | 38 min |
| Carroll County | 28,641 | $52K | $142K | 75% | 18% | 81% | 28 min |
| Carter County | 56,712 | $50K | $168K | 75% | 21% | 84% | 26 min |
| Cheatham County | 41,829 | $90K | $339K | 82% | 27% | 91% | 36 min |
| Chester County | 17,611 | $59K | $164K | 75% | 22% | 87% | 30 min |
| Claiborne County | 32,466 | $49K | $160K | 72% | 18% | 79% | 30 min |
| Clay County | 7,670 | $40K | $136K | 74% | 12% | 79% | 30 min |
| Cocke County | 36,813 | $48K | $158K | 75% | 11% | 79% | 35 min |
| Coffee County | 59,710 | $62K | $247K | 69% | 21% | 84% | 28 min |
| Crockett County | 13,944 | $62K | $159K | 72% | 17% | 87% | 26 min |
| Cumberland County | 63,553 | $60K | $251K | 80% | 19% | 87% | 25 min |
| Davidson County | 715,388 | $78K | $417K | 53% | 48% | 93% | 27 min |
| DeKalb County | 20,959 | $53K | $236K | 73% | 21% | 83% | 32 min |
| Decatur County | 11,579 | $45K | $140K | 74% | 14% | 81% | 29 min |
| Dickson County | 55,983 | $75K | $306K | 80% | 22% | 86% | 36 min |
| Dyer County | 36,508 | $58K | $166K | 62% | 21% | 90% | 22 min |
| Fayette County | 43,267 | $88K | $341K | 81% | 27% | 91% | 37 min |
| Fentress County | 19,309 | $51K | $168K | 83% | 15% | 88% | 27 min |
| Franklin County | 43,990 | $63K | $237K | 77% | 24% | 84% | 26 min |
| Gibson County | 50,869 | $63K | $157K | 69% | 21% | 90% | 28 min |
| Giles County | 30,620 | $62K | $234K | 73% | 20% | 83% | 33 min |
| Grainger County | 24,266 | $51K | $189K | 77% | 16% | 80% | 35 min |
| Greene County | 71,628 | $56K | $208K | 77% | 19% | 80% | 28 min |
| Grundy County | 13,819 | $48K | $154K | 84% | 14% | 87% | 38 min |
| Hamblen County | 65,669 | $55K | $211K | 70% | 20% | 88% | 26 min |
| Hamilton County | 376,192 | $76K | $313K | 64% | 38% | 92% | 24 min |
| Hancock County | 6,852 | $35K | $135K | 75% | 11% | 71% | 33 min |
| Hardeman County | 25,433 | $46K | $122K | 72% | 12% | 82% | 36 min |
| Hardin County | 27,249 | $50K | $160K | 78% | 15% | 87% | 27 min |
| Hawkins County | 57,964 | $57K | $176K | 80% | 16% | 86% | 30 min |
| Haywood County | 17,475 | $50K | $152K | 61% | 15% | 82% | 29 min |
| Henderson County | 27,980 | $55K | $165K | 73% | 16% | 83% | 29 min |
| Henry County | 32,412 | $51K | $160K | 74% | 19% | 85% | 23 min |
| Hickman County | 25,436 | $68K | $224K | 79% | 14% | 80% | 40 min |
| Houston County | 8,353 | $60K | $173K | 81% | 14% | 84% | 41 min |
| Humphreys County | 19,214 | $61K | $193K | 78% | 16% | 83% | 36 min |
| Jackson County | 12,029 | $48K | $156K | 81% | 15% | 84% | 35 min |
| Jefferson County | 56,864 | $66K | $229K | 76% | 21% | 87% | 31 min |
| Johnson County | 18,196 | $53K | $179K | 78% | 18% | 81% | 27 min |
| Knox County | 494,148 | $74K | $321K | 65% | 41% | 90% | 24 min |
| Lake County | 6,579 | $29K | $98K | 48% | 9% | 78% | 24 min |
| Lauderdale County | 24,784 | $50K | $143K | 64% | 12% | 86% | 28 min |
| Lawrence County | 45,385 | $55K | $194K | 78% | 15% | 84% | 28 min |
| Lewis County | 12,992 | $56K | $173K | 82% | 10% | 81% | 36 min |
| Lincoln County | 35,946 | $65K | $230K | 76% | 21% | 81% | 34 min |
| Loudon County | 58,580 | $84K | $348K | 80% | 29% | 91% | 26 min |
| Macon County | 26,240 | $59K | $226K | 74% | 13% | 85% | 37 min |
| Madison County | 99,295 | $60K | $212K | 62% | 27% | 89% | 22 min |
| Marion County | 29,250 | $62K | $195K | 79% | 17% | 85% | 36 min |
| Marshall County | 36,049 | $71K | $280K | 77% | 23% | 88% | 33 min |
| Maury County | 107,791 | $76K | $356K | 71% | 28% | 91% | 32 min |
| McMinn County | 54,884 | $61K | $212K | 76% | 19% | 88% | 27 min |
| McNairy County | 25,970 | $53K | $162K | 80% | 13% | 84% | 28 min |
| Meigs County | 13,343 | $61K | $180K | 81% | 14% | 82% | 37 min |
| Monroe County | 47,695 | $57K | $228K | 72% | 17% | 85% | 30 min |
| Montgomery County | 234,153 | $76K | $280K | 62% | 31% | 94% | 30 min |
| Moore County | 6,674 | $66K | $285K | 83% | 24% | 77% | 27 min |
| Morgan County | 21,361 | $66K | $166K | 85% | 14% | 87% | 37 min |
| Obion County | 30,453 | $55K | $134K | 68% | 18% | 84% | 22 min |
| Overton County | 23,065 | $49K | $173K | 77% | 15% | 80% | 28 min |
| Perry County | 8,697 | $56K | $127K | 74% | 14% | 82% | 35 min |
| Pickett County | 5,079 | $49K | $179K | 83% | 19% | 79% | 33 min |
| Polk County | 17,898 | $63K | $170K | 84% | 17% | 84% | 34 min |
| Putnam County | 82,558 | $59K | $283K | 61% | 30% | 88% | 23 min |
| Rhea County | 33,992 | $55K | $206K | 72% | 19% | 89% | 31 min |
| Roane County | 55,208 | $72K | $233K | 78% | 22% | 89% | 30 min |
| Robertson County | 75,539 | $83K | $335K | 78% | 22% | 87% | 34 min |
| Rutherford County | 360,646 | $85K | $383K | 65% | 36% | 94% | 31 min |
| Scott County | 22,113 | $45K | $125K | 72% | 13% | 80% | 33 min |
| Sequatchie County | 16,809 | $59K | $233K | 78% | 21% | 84% | 34 min |
| Sevier County | 99,652 | $63K | $299K | 71% | 22% | 87% | 29 min |
| Shelby County | 919,173 | $64K | $249K | 54% | 34% | 90% | 24 min |
| Smith County | 20,389 | $66K | $244K | 77% | 19% | 88% | 33 min |
| Stewart County | 14,027 | $63K | $205K | 81% | 18% | 88% | 38 min |
| Sullivan County | 160,624 | $59K | $213K | 72% | 27% | 88% | 24 min |
| Sumner County | 204,424 | $90K | $393K | 72% | 34% | 93% | 31 min |
| Tipton County | 61,553 | $74K | $241K | 76% | 21% | 88% | 36 min |
| Trousdale County | 11,957 | $73K | $338K | 75% | 14% | 90% | 37 min |
| Unicoi County | 17,756 | $52K | $190K | 73% | 21% | 84% | 27 min |
| Union County | 20,431 | $63K | $204K | 80% | 14% | 81% | 38 min |
| Van Buren County | 6,437 | $55K | $159K | 86% | 14% | 86% | 32 min |
| Warren County | 42,166 | $55K | $193K | 72% | 14% | 87% | 29 min |
| Washington County | 136,261 | $63K | $249K | 65% | 34% | 89% | 23 min |
| Wayne County | 16,168 | $52K | $131K | 80% | 14% | 84% | 34 min |
| Weakley County | 33,016 | $52K | $151K | 66% | 23% | 85% | 23 min |
| White County | 28,160 | $52K | $207K | 77% | 15% | 86% | 26 min |
| Williamson County | 260,351 | $136K | $752K | 79% | 63% | 96% | 30 min |
| Wilson County | 158,805 | $96K | $428K | 77% | 38% | 94% | 33 min |
Source: U.S. Census Bureau, American Community Survey 2020–2024 5-year estimates
People.
7,066,383 residents in 2,824,277 households, next to the United States figure.
Source: U.S. Census Bureau, American Community Survey 2020–2024 5-year estimates
Homes.
3,143,670 housing units; the median owner-occupied home is valued at $286,700 (±$1,492).
When homes were built
Source: U.S. Census Bureau, American Community Survey 2020–2024 5-year estimates
Income and work.
Household income and work, in 2024 dollars; median household income ±$429.
The poverty rate uses the federal poverty thresholds, which vary with family size. It says nothing on its own about what a neighborhood is like to live in.
Source: U.S. Census Bureau, American Community Survey 2020–2024 5-year estimates
Getting around.
How workers aged 16 and over get to work, and how long it takes.
Source: U.S. Census Bureau, American Community Survey 2020–2024 5-year estimates
Internet.
Home internet subscriptions.
American Community Survey figures are estimates from a rolling sample, averaged over 2020–2024. Each comes with a margin of error, which is wider in places with fewer people.
Source: U.S. Census Bureau, American Community Survey 2020–2024 5-year estimates
Counties in Tennessee.
Every county has its own page, with all of its ZIP codes.