Michigan
Michigan has 10,077,761 residents in 83 counties and 962 ZIP codes. The median household income is $72,875, 10% below the national figure, and the typical owner-occupied home is valued at $231,600. 73% of households own their home.
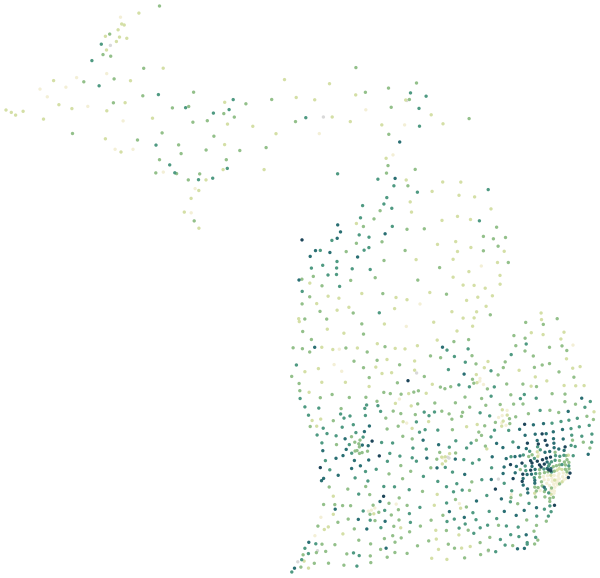
Sources: U.S. Census Bureau, American Community Survey 2020–2024 5-year estimates · U.S. Census Bureau, 2024 Gazetteer and 2020 ZCTA relationship files
All 83 counties.
Colour shows where each county sits among the others in the table, from lowest to highest.
| County | Residents | Household income | Home value | Owners | Bachelor's+ | Broadband | Commute |
|---|---|---|---|---|---|---|---|
| Alcona County | 10,397 | $55K | $163K | 90% | 21% | 83% | 28 min |
| Alger County | 8,762 | $61K | $176K | 86% | 21% | 85% | 24 min |
| Allegan County | 121,456 | $83K | $267K | 87% | 27% | 92% | 26 min |
| Alpena County | 28,880 | $54K | $154K | 80% | 18% | 85% | 19 min |
| Antrim County | 24,127 | $72K | $256K | 86% | 34% | 89% | 27 min |
| Arenac County | 15,077 | $59K | $151K | 86% | 16% | 87% | 28 min |
| Baraga County | 8,191 | $55K | $138K | 79% | 15% | 84% | 19 min |
| Barry County | 63,409 | $78K | $264K | 87% | 25% | 87% | 30 min |
| Bay County | 103,008 | $62K | $152K | 77% | 22% | 88% | 24 min |
| Benzie County | 18,310 | $75K | $286K | 88% | 37% | 93% | 26 min |
| Berrien County | 153,288 | $65K | $224K | 73% | 31% | 89% | 22 min |
| Branch County | 45,300 | $64K | $163K | 78% | 17% | 85% | 24 min |
| Calhoun County | 133,778 | $63K | $163K | 73% | 23% | 90% | 22 min |
| Cass County | 51,520 | $70K | $218K | 82% | 22% | 89% | 26 min |
| Charlevoix County | 26,108 | $77K | $277K | 84% | 35% | 90% | 21 min |
| Cheboygan County | 25,865 | $63K | $193K | 86% | 24% | 87% | 27 min |
| Chippewa County | 36,295 | $62K | $162K | 75% | 23% | 88% | 19 min |
| Clare County | 31,218 | $49K | $134K | 87% | 13% | 82% | 30 min |
| Clinton County | 79,626 | $88K | $260K | 82% | 35% | 90% | 25 min |
| Crawford County | 13,369 | $60K | $163K | 80% | 20% | 90% | 25 min |
| Delta County | 36,813 | $58K | $157K | 82% | 21% | 87% | 19 min |
| Dickinson County | 25,954 | $65K | $153K | 82% | 25% | 88% | 18 min |
| Eaton County | 109,130 | $80K | $217K | 74% | 31% | 91% | 25 min |
| Emmet County | 34,125 | $78K | $316K | 77% | 42% | 91% | 21 min |
| Genesee County | 403,305 | $62K | $182K | 71% | 23% | 90% | 29 min |
| Gladwin County | 25,693 | $55K | $162K | 86% | 17% | 86% | 31 min |
| Gogebic County | 14,319 | $53K | $107K | 81% | 23% | 86% | 20 min |
| Grand Traverse County | 96,166 | $82K | $339K | 77% | 41% | 92% | 22 min |
| Gratiot County | 41,385 | $64K | $148K | 79% | 19% | 86% | 25 min |
| Hillsdale County | 45,654 | $64K | $176K | 82% | 21% | 86% | 26 min |
| Houghton County | 37,693 | $59K | $160K | 72% | 37% | 89% | 17 min |
| Huron County | 31,113 | $59K | $154K | 82% | 19% | 83% | 22 min |
| Ingham County | 283,913 | $66K | $199K | 60% | 41% | 90% | 22 min |
| Ionia County | 66,574 | $76K | $199K | 77% | 19% | 88% | 29 min |
| Iosco County | 25,347 | $50K | $142K | 82% | 19% | 85% | 22 min |
| Iron County | 11,667 | $56K | $109K | 85% | 23% | 83% | 21 min |
| Isabella County | 64,565 | $55K | $170K | 62% | 31% | 82% | 21 min |
| Jackson County | 160,060 | $66K | $194K | 75% | 23% | 92% | 24 min |
| Kalamazoo County | 262,375 | $73K | $242K | 65% | 41% | 91% | 22 min |
| Kalkaska County | 18,239 | $69K | $189K | 88% | 19% | 87% | 32 min |
| Kent County | 663,150 | $83K | $290K | 70% | 41% | 92% | 23 min |
| Keweenaw County | 2,133 | $53K | $170K | 91% | 41% | 86% | 22 min |
| Lake County | 12,563 | $51K | $134K | 82% | 13% | 81% | 37 min |
| Lapeer County | 88,837 | $77K | $239K | 86% | 20% | 88% | 37 min |
| Leelanau County | 22,734 | $99K | $458K | 92% | 52% | 93% | 25 min |
| Lenawee County | 98,415 | $71K | $197K | 80% | 23% | 90% | 30 min |
| Livingston County | 195,833 | $103K | $357K | 87% | 40% | 93% | 33 min |
| Luce County | 6,271 | $55K | $112K | 83% | 17% | 86% | 21 min |
| Mackinac County | 10,957 | $64K | $175K | 78% | 25% | 84% | 26 min |
| Macomb County | 879,853 | $78K | $244K | 75% | 28% | 93% | 28 min |
| Manistee County | 25,350 | $64K | $182K | 86% | 25% | 86% | 23 min |
| Marquette County | 67,112 | $65K | $217K | 70% | 37% | 85% | 20 min |
| Mason County | 29,207 | $65K | $220K | 78% | 27% | 87% | 20 min |
| Mecosta County | 41,242 | $61K | $179K | 77% | 23% | 82% | 26 min |
| Menominee County | 23,247 | $56K | $152K | 81% | 19% | 85% | 23 min |
| Midland County | 83,757 | $78K | $195K | 78% | 37% | 90% | 25 min |
| Missaukee County | 15,207 | $66K | $170K | 85% | 19% | 87% | 26 min |
| Monroe County | 155,505 | $77K | $229K | 82% | 23% | 89% | 28 min |
| Montcalm County | 67,816 | $67K | $186K | 83% | 16% | 84% | 33 min |
| Montmorency County | 9,516 | $50K | $159K | 88% | 16% | 83% | 28 min |
| Muskegon County | 175,961 | $65K | $198K | 78% | 21% | 89% | 23 min |
| Newaygo County | 50,792 | $63K | $187K | 87% | 18% | 84% | 32 min |
| Oakland County | 1,279,825 | $98K | $344K | 73% | 51% | 94% | 28 min |
| Oceana County | 26,915 | $62K | $190K | 85% | 22% | 83% | 25 min |
| Ogemaw County | 20,885 | $55K | $155K | 84% | 17% | 86% | 28 min |
| Ontonagon County | 5,850 | $54K | $112K | 87% | 18% | 86% | 25 min |
| Osceola County | 23,227 | $58K | $155K | 84% | 17% | 82% | 27 min |
| Oscoda County | 8,425 | $50K | $126K | 87% | 16% | 81% | 28 min |
| Otsego County | 25,584 | $68K | $220K | 77% | 26% | 91% | 22 min |
| Ottawa County | 301,203 | $91K | $323K | 79% | 39% | 93% | 22 min |
| Presque Isle County | 13,209 | $59K | $151K | 89% | 21% | 85% | 28 min |
| Roscommon County | 23,737 | $55K | $159K | 85% | 20% | 88% | 25 min |
| Saginaw County | 188,665 | $61K | $153K | 74% | 24% | 89% | 24 min |
| Sanilac County | 40,462 | $59K | $168K | 83% | 17% | 85% | 30 min |
| Schoolcraft County | 8,128 | $57K | $142K | 87% | 21% | 86% | 20 min |
| Shiawassee County | 67,991 | $67K | $172K | 80% | 20% | 89% | 30 min |
| St. Clair County | 160,221 | $71K | $225K | 81% | 20% | 91% | 31 min |
| St. Joseph County | 60,969 | $66K | $178K | 76% | 17% | 89% | 22 min |
| Tuscola County | 52,980 | $64K | $150K | 86% | 16% | 85% | 31 min |
| Van Buren County | 75,795 | $68K | $207K | 81% | 23% | 89% | 26 min |
| Washtenaw County | 369,822 | $89K | $374K | 62% | 59% | 94% | 25 min |
| Wayne County | 1,772,259 | $61K | $179K | 65% | 28% | 90% | 27 min |
| Wexford County | 34,077 | $61K | $170K | 81% | 21% | 88% | 25 min |
Source: U.S. Census Bureau, American Community Survey 2020–2024 5-year estimates
People.
10,077,761 residents in 4,076,369 households, next to the United States figure.
Source: U.S. Census Bureau, American Community Survey 2020–2024 5-year estimates
Homes.
4,622,236 housing units; the median owner-occupied home is valued at $231,600 (±$642).
When homes were built
Source: U.S. Census Bureau, American Community Survey 2020–2024 5-year estimates
Income and work.
Household income and work, in 2024 dollars; median household income ±$293.
The poverty rate uses the federal poverty thresholds, which vary with family size. It says nothing on its own about what a neighborhood is like to live in.
Source: U.S. Census Bureau, American Community Survey 2020–2024 5-year estimates
Getting around.
How workers aged 16 and over get to work, and how long it takes.
Source: U.S. Census Bureau, American Community Survey 2020–2024 5-year estimates
Internet.
Home internet subscriptions.
American Community Survey figures are estimates from a rolling sample, averaged over 2020–2024. Each comes with a margin of error, which is wider in places with fewer people.
Source: U.S. Census Bureau, American Community Survey 2020–2024 5-year estimates
Counties in Michigan.
Every county has its own page, with all of its ZIP codes.