Lüneburg district
The Lüneburg district had 176,031 residents at the 2022 census, in 43 municipalities. Average net rent of €7.88/m² was 19% above the state average. 48.2% of homes were owner-occupied, and the average age was 43.8.
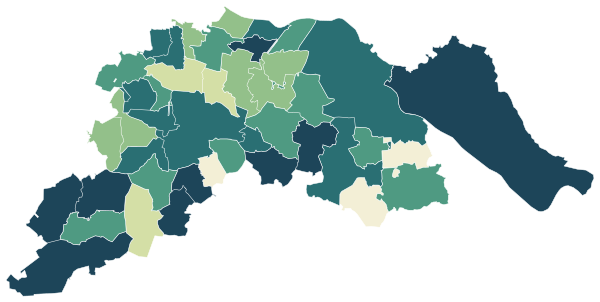
Sources: Federal and State Statistical Offices of Germany, 2022 census grid results (open data, with attribution) · © GeoBasis-DE / BKG (2023), administrative areas VG250 as of 15 May 2022, dl-de/by-2-0 · © OpenStreetMap contributors (ODbL)
All 43 municipalities.
Colour shows where each one sits among the others in the table, from lowest to highest.
| Municipality | Residents | Rent | Owner-occupied | Vacant | Avg. age | Green 500 m | Services 15 min |
|---|---|---|---|---|---|---|---|
| Adendorf | 10,228 | €7.89/m² | 58% | 3.2% | 46.6 | 9% | 74 |
| Amelinghausen | 3,696 | €6.26/m² | 49% | 2.9% | 46.0 | 21% | 40 |
| Amt Neuhaus | 4,278 | €5.24/m² | 63% | 9.2% | 48.6 | 37% | 32 |
| Artlenburg | 1,713 | €6.63/m² | 60% | 4.8% | 43.2 | 11% | 11 |
| Bardowick | 6,588 | €7.78/m² | 53% | 2.8% | 43.6 | 5% | 47 |
| Barendorf | 2,414 | €6.86/m² | 74% | 1.4% | 42.2 | 26% | 24 |
| Barnstedt | 747 | €5.60/m² | 74% | 4.7% | 47.7 | 40% | 2 |
| Barum | 1,982 | €6.85/m² | 72% | 2.5% | 42.9 | 12% | 9 |
| Betzendorf | 1,088 | €5.60/m² | 69% | 5.1% | 46.0 | 7% | 5 |
| Bleckede | 9,110 | €6.29/m² | 57% | 4.9% | 46.3 | 22% | 66 |
| Boitze | 320 | €5.24/m² | 57% | 5.5% | 49.1 | 0% | 0 |
| Brietlingen | 3,346 | €7.25/m² | 70% | 2.1% | 43.5 | 22% | 12 |
| Dahlem | 506 | €5.15/m² | 66% | 6.5% | 46.6 | 18% | 0 |
| Dahlenburg | 2,984 | €5.91/m² | 58% | 4.6% | 44.1 | 30% | 50 |
| Deutsch Evern | 3,604 | €7.49/m² | 69% | 2.4% | 45.1 | 5% | 33 |
| Echem | 1,041 | €5.97/m² | 64% | 4.3% | 41.5 | 44% | 7 |
| Embsen | 2,783 | €7.37/m² | 66% | 3.8% | 43.1 | 20% | 17 |
| Handorf | 2,104 | €6.83/m² | 67% | 1.4% | 43.0 | 26% | 21 |
| Hittbergen | 981 | €6.52/m² | 60% | 4.0% | 43.4 | 19% | 1 |
| Hohnstorf (Elbe) | 2,320 | €6.52/m² | 63% | 3.8% | 46.4 | 26% | 89 |
| Kirchgellersen | 2,362 | €6.89/m² | 63% | 2.9% | 43.6 | 11% | 22 |
| Lüdersburg | 627 | €5.90/m² | 70% | 6.5% | 45.8 | 11% | 3 |
| Lüneburg | 73,358 | €8.46/m² | 32% | 3.6% | 42.3 | 23% | 148 |
| Mechtersen | 661 | €7.78/m² | 73% | – | 46.3 | 23% | 3 |
| Melbeck | 3,275 | €6.96/m² | 67% | 2.8% | 43.9 | 32% | 36 |
| Nahrendorf | 1,129 | €4.69/m² | 67% | 7.0% | 45.1 | 18% | 7 |
| Neetze | 2,616 | €6.26/m² | 63% | 3.1% | 42.9 | 22% | 24 |
| Oldendorf (Luhe) | 926 | €6.32/m² | 59% | 5.3% | 43.7 | 34% | 11 |
| Radbruch | 2,185 | €7.17/m² | 72% | 3.2% | 42.0 | 16% | 23 |
| Rehlingen | 691 | €5.43/m² | 65% | 9.0% | 45.9 | 49% | 2 |
| Reinstorf | 1,234 | €6.48/m² | 65% | 6.4% | 44.5 | 20% | 4 |
| Reppenstedt | 6,891 | €7.40/m² | 57% | 1.9% | 46.4 | 23% | 53 |
| Rullstorf | 1,828 | €6.62/m² | 72% | 4.0% | 45.4 | 10% | 4 |
| Scharnebeck | 3,211 | €6.92/m² | 56% | 3.8% | 43.1 | 15% | 58 |
| Soderstorf | 1,465 | €6.17/m² | 72% | 3.2% | 44.7 | 34% | 12 |
| Südergellersen | 1,594 | €6.76/m² | 74% | 2.1% | 44.3 | 26% | 8 |
| Thomasburg | 1,305 | €5.39/m² | 73% | 4.0% | 43.1 | 45% | 4 |
| Tosterglope | 601 | €5.42/m² | 82% | 6.1% | 48.1 | 5% | 2 |
| Vastorf | 814 | €5.90/m² | 69% | 3.2% | 44.0 | 47% | 7 |
| Vögelsen | 2,324 | €8.53/m² | 70% | 2.9% | 46.3 | 17% | 24 |
| Wendisch Evern | 1,690 | €7.16/m² | 69% | 3.4% | 44.1 | 16% | 23 |
| Westergellersen | 1,989 | €6.42/m² | 74% | 2.5% | 43.1 | 12% | 11 |
| Wittorf | 1,422 | €7.21/m² | 62% | 4.5% | 41.5 | 29% | 3 |
Sources: Federal and State Statistical Offices of Germany, 2022 census grid results (open data, with attribution) · © OpenStreetMap contributors (ODbL)
People.
Age and households at the 2022 census, next to the figure for Lower Saxony.
Source: Federal and State Statistical Offices of Germany, 2022 census grid results (open data, with attribution)
Homes.
50,515 residential buildings.
When residential buildings were built
Main type of heating
Net rent comes from the 2022 census (reference date 15 May 2022) and covers every rented home, including long-standing tenancies, so it is usually lower than the asking rents in new listings.
Figures for municipalities, districts and states are built up from the census 100-metre grid cells, with rents weighted by the number of homes. Vacancy and owner-occupation rates come from the one-kilometre grid, as they are mostly withheld in the 100-metre cells.
Source: Federal and State Statistical Offices of Germany, 2022 census grid results (open data, with attribution)
Everyday life.
83 everyday shops and services within a 15-minute walk, for the average resident; 21% green space within 500 metres.
Source: © OpenStreetMap contributors (ODbL)
Crime.
Offences recorded by the police in 2025 (Lüneburg district), next to the state average.
| Offence | Cases | per 100,000 | state, per 100,000 |
|---|---|---|---|
| Violent crime | 462 | 258 | 250 |
| Common assault | 1,208 | 673 | 534 |
| Robbery | 130 | 72 | 47 |
| Domestic burglary | 255 | 142 | 100 |
| All theft | 4,330 | 2,413 | 1,948 |
| Bicycle theft | 739 | 412 | 259 |
| Car theft | 34 | 19 | 24 |
| Theft from vehicles | 498 | 278 | 191 |
| Shoplifting | 928 | 517 | 446 |
| Pickpocketing | 233 | 130 | 84 |
| Fraud | 1,299 | 724 | 740 |
| Criminal damage | 1,369 | 763 | 617 |
| Street crime | 2,557 | 1,425 | 1,045 |
Police crime statistics count offences that became known to the police and were fully processed by them, by place of offence. The rate relates them to the resident population, so cities with many commuters, visitors and shops show higher rates. Offences against residence and asylum law and drug offences are not shown here; drug offences mostly reflect how actively the police carry out checks.
Source: PKS Bundeskriminalamt (Federal Criminal Police Office), reporting year 2025, version 1.1 (Data licence Germany – attribution 2.0)
Around here.
Photographs taken near Lüneburg district, shared on Wikimedia Commons under free licences.

i


i


i

Other districts in Lower Saxony.