Kentucky
Kentucky has 4,534,824 residents in 120 counties and 723 ZIP codes. The median household income is $63,726, 21% below the national figure, and the typical owner-occupied home is valued at $205,600. 68% of households own their home.
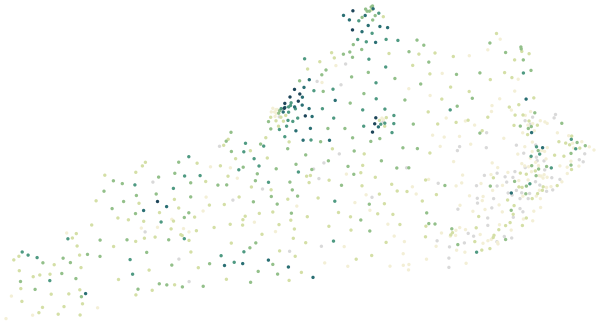
Sources: U.S. Census Bureau, American Community Survey 2020–2024 5-year estimates · U.S. Census Bureau, 2024 Gazetteer and 2020 ZCTA relationship files
All 120 counties.
Colour shows where each county sits among the others in the table, from lowest to highest.
| County | Residents | Household income | Home value | Owners | Bachelor's+ | Broadband | Commute |
|---|---|---|---|---|---|---|---|
| Adair County | 19,089 | $54K | $151K | 77% | 22% | 85% | 25 min |
| Allen County | 21,293 | $61K | $192K | 75% | 18% | 83% | 29 min |
| Anderson County | 24,353 | $74K | $225K | 78% | 26% | 89% | 32 min |
| Ballard County | 7,654 | $66K | $146K | 76% | 18% | 88% | 28 min |
| Barren County | 44,938 | $51K | $178K | 65% | 18% | 87% | 25 min |
| Bath County | 12,851 | $57K | $130K | 75% | 12% | 84% | 30 min |
| Bell County | 23,509 | $31K | $89K | 59% | 16% | 79% | 24 min |
| Boone County | 139,841 | $99K | $277K | 76% | 36% | 94% | 27 min |
| Bourbon County | 20,240 | $61K | $229K | 64% | 26% | 85% | 27 min |
| Boyd County | 47,911 | $61K | $131K | 70% | 20% | 87% | 23 min |
| Boyle County | 30,941 | $61K | $210K | 68% | 26% | 87% | 23 min |
| Bracken County | 8,444 | $66K | $125K | 79% | 18% | 90% | 39 min |
| Breathitt County | 13,276 | $35K | $70K | 77% | 15% | 81% | 30 min |
| Breckinridge County | 20,881 | $56K | $157K | 81% | 14% | 84% | 35 min |
| Bullitt County | 84,027 | $81K | $247K | 85% | 20% | 92% | 30 min |
| Butler County | 12,393 | $56K | $111K | 74% | 10% | 79% | 29 min |
| Caldwell County | 12,618 | $60K | $119K | 70% | 17% | 87% | 27 min |
| Calloway County | 38,224 | $53K | $183K | 64% | 31% | 82% | 19 min |
| Campbell County | 93,426 | $78K | $252K | 71% | 40% | 92% | 25 min |
| Carlisle County | 4,762 | $62K | $120K | 80% | 15% | 88% | 28 min |
| Carroll County | 10,954 | $56K | $141K | 66% | 11% | 84% | 25 min |
| Carter County | 26,341 | $51K | $133K | 80% | 16% | 81% | 31 min |
| Casey County | 15,914 | $46K | $136K | 80% | 13% | 81% | 31 min |
| Christian County | 72,069 | $55K | $174K | 50% | 20% | 83% | 21 min |
| Clark County | 37,192 | $64K | $206K | 71% | 23% | 91% | 26 min |
| Clay County | 19,921 | $41K | $91K | 76% | 16% | 84% | 30 min |
| Clinton County | 9,202 | $45K | $122K | 71% | 18% | 82% | 22 min |
| Crittenden County | 8,979 | $47K | $127K | 78% | 15% | 79% | 27 min |
| Cumberland County | 5,948 | $40K | $141K | 76% | 19% | 81% | 21 min |
| Daviess County | 103,648 | $68K | $200K | 68% | 26% | 90% | 21 min |
| Edmonson County | 12,355 | $55K | $160K | 80% | 11% | 87% | 34 min |
| Elliott County | 7,307 | $46K | $124K | 82% | 9% | 88% | 39 min |
| Estill County | 14,035 | $46K | $120K | 70% | 12% | 81% | 36 min |
| Fayette County | 323,725 | $69K | $294K | 54% | 48% | 93% | 23 min |
| Fleming County | 15,323 | $49K | $135K | 75% | 19% | 81% | 34 min |
| Floyd County | 35,224 | $41K | $99K | 72% | 15% | 85% | 29 min |
| Franklin County | 51,842 | $65K | $217K | 65% | 32% | 86% | 22 min |
| Fulton County | 6,409 | $38K | $79K | 62% | 16% | 87% | 23 min |
| Gallatin County | 8,769 | $63K | $178K | 75% | 15% | 87% | 32 min |
| Garrard County | 17,568 | $63K | $205K | 80% | 19% | 87% | 35 min |
| Grant County | 25,418 | $69K | $210K | 75% | 15% | 89% | 29 min |
| Graves County | 36,630 | $51K | $148K | 76% | 18% | 82% | 22 min |
| Grayson County | 26,707 | $51K | $165K | 75% | 16% | 83% | 30 min |
| Green County | 11,369 | $47K | $125K | 78% | 17% | 84% | 30 min |
| Greenup County | 35,501 | $61K | $134K | 80% | 19% | 85% | 26 min |
| Hancock County | 9,034 | $65K | $141K | 77% | 17% | 84% | 27 min |
| Hardin County | 111,942 | $68K | $226K | 63% | 25% | 90% | 24 min |
| Harlan County | 25,772 | $42K | $74K | 72% | 13% | 84% | 26 min |
| Harrison County | 19,140 | $66K | $202K | 71% | 23% | 82% | 30 min |
| Hart County | 19,603 | $52K | $146K | 72% | 12% | 84% | 29 min |
| Henderson County | 44,280 | $59K | $172K | 65% | 20% | 91% | 24 min |
| Henry County | 15,856 | $63K | $198K | 76% | 16% | 84% | 32 min |
| Hickman County | 4,439 | $61K | $116K | 71% | 15% | 90% | 23 min |
| Hopkins County | 45,119 | $57K | $143K | 71% | 17% | 90% | 23 min |
| Jackson County | 13,086 | $40K | $112K | 77% | 9% | 83% | 39 min |
| Jefferson County | 783,022 | $70K | $248K | 62% | 37% | 91% | 24 min |
| Jessamine County | 54,588 | $75K | $268K | 67% | 34% | 91% | 26 min |
| Johnson County | 22,334 | $45K | $120K | 68% | 17% | 89% | 25 min |
| Kenton County | 171,288 | $81K | $244K | 71% | 37% | 92% | 24 min |
| Knott County | 13,830 | $42K | $77K | 73% | 20% | 84% | 26 min |
| Knox County | 29,865 | $33K | $119K | 65% | 14% | 85% | 26 min |
| Larue County | 15,107 | $67K | $184K | 79% | 16% | 86% | 30 min |
| Laurel County | 62,983 | $58K | $160K | 72% | 18% | 91% | 24 min |
| Lawrence County | 16,077 | $47K | $112K | 78% | 15% | 84% | 32 min |
| Lee County | 7,339 | $38K | $84K | 78% | 9% | 76% | 40 min |
| Leslie County | 10,079 | $36K | $69K | 86% | 12% | 82% | 40 min |
| Letcher County | 20,808 | $42K | $67K | 74% | 13% | 87% | 29 min |
| Lewis County | 12,965 | $47K | $96K | 79% | 15% | 85% | 38 min |
| Lincoln County | 24,504 | $52K | $147K | 76% | 16% | 85% | 33 min |
| Livingston County | 8,903 | $59K | $126K | 81% | 15% | 83% | 31 min |
| Logan County | 27,986 | $60K | $165K | 74% | 16% | 87% | 30 min |
| Lyon County | 8,900 | $65K | $190K | 80% | 17% | 90% | 30 min |
| Madison County | 95,769 | $63K | $232K | 62% | 34% | 89% | 27 min |
| Magoffin County | 11,348 | $33K | $89K | 75% | 13% | 84% | 32 min |
| Marion County | 19,749 | $60K | $168K | 78% | 15% | 86% | 24 min |
| Marshall County | 31,743 | $66K | $174K | 82% | 21% | 86% | 25 min |
| Martin County | 11,027 | $37K | $87K | 85% | 10% | 84% | 34 min |
| Mason County | 16,956 | $52K | $162K | 66% | 20% | 85% | 28 min |
| McCracken County | 67,564 | $64K | $188K | 69% | 29% | 89% | 19 min |
| McCreary County | 16,867 | $34K | $85K | 74% | 9% | 80% | 35 min |
| McLean County | 9,114 | $66K | $149K | 83% | 17% | 85% | 34 min |
| Meade County | 30,158 | $74K | $208K | 74% | 20% | 92% | 35 min |
| Menifee County | 6,230 | $45K | $126K | 76% | 15% | 81% | 33 min |
| Mercer County | 23,028 | $65K | $202K | 76% | 25% | 87% | 29 min |
| Metcalfe County | 10,425 | $51K | $110K | 78% | 13% | 83% | 27 min |
| Monroe County | 11,269 | $51K | $116K | 71% | 16% | 84% | 26 min |
| Montgomery County | 28,395 | $56K | $172K | 68% | 21% | 89% | 28 min |
| Morgan County | 14,053 | $48K | $118K | 79% | 19% | 85% | 30 min |
| Muhlenberg County | 30,591 | $52K | $127K | 79% | 15% | 84% | 29 min |
| Nelson County | 47,606 | $70K | $238K | 78% | 24% | 91% | 29 min |
| Nicholas County | 7,708 | $60K | $123K | 75% | 10% | 82% | 36 min |
| Ohio County | 23,735 | $58K | $121K | 77% | 14% | 85% | 30 min |
| Oldham County | 69,257 | $122K | $393K | 87% | 46% | 95% | 28 min |
| Owen County | 11,330 | $61K | $169K | 88% | 18% | 80% | 42 min |
| Owsley County | 3,971 | $22K | $80K | 70% | 7% | 73% | 26 min |
| Pendleton County | 14,723 | $65K | $160K | 75% | 15% | 81% | 38 min |
| Perry County | 27,499 | $42K | $92K | 70% | 15% | 89% | 26 min |
| Pike County | 56,727 | $44K | $112K | 75% | 18% | 83% | 27 min |
| Powell County | 13,038 | $40K | $141K | 68% | 14% | 80% | 30 min |
| Pulaski County | 65,897 | $52K | $167K | 73% | 18% | 85% | 24 min |
| Robertson County | 2,283 | $52K | $165K | 80% | 14% | 78% | 32 min |
| Rockcastle County | 16,163 | $49K | $124K | 74% | 14% | 80% | 29 min |
| Rowan County | 24,578 | $54K | $162K | 62% | 26% | 93% | 26 min |
| Russell County | 18,221 | $45K | $163K | 71% | 15% | 82% | 22 min |
| Scott County | 59,536 | $85K | $289K | 72% | 35% | 92% | 24 min |
| Shelby County | 49,096 | $83K | $305K | 74% | 33% | 92% | 29 min |
| Simpson County | 19,972 | $60K | $229K | 67% | 19% | 89% | 23 min |
| Spencer County | 20,193 | $103K | $330K | 88% | 24% | 92% | 36 min |
| Taylor County | 26,397 | $60K | $174K | 69% | 23% | 88% | 23 min |
| Todd County | 12,469 | $61K | $167K | 76% | 17% | 78% | 28 min |
| Trigg County | 14,315 | $60K | $208K | 77% | 22% | 78% | 26 min |
| Trimble County | 8,550 | $66K | $172K | 80% | 17% | 85% | 29 min |
| Union County | 13,260 | $60K | $105K | 70% | 13% | 89% | 25 min |
| Warren County | 140,918 | $66K | $258K | 56% | 32% | 91% | 22 min |
| Washington County | 12,140 | $62K | $179K | 78% | 20% | 83% | 25 min |
| Wayne County | 19,602 | $46K | $136K | 69% | 14% | 86% | 25 min |
| Webster County | 12,842 | $60K | $113K | 74% | 13% | 84% | 30 min |
| Whitley County | 36,920 | $45K | $132K | 67% | 21% | 83% | 26 min |
| Wolfe County | 6,443 | $30K | $76K | 74% | 9% | 89% | 35 min |
| Woodford County | 27,279 | $84K | $300K | 72% | 41% | 93% | 26 min |
Source: U.S. Census Bureau, American Community Survey 2020–2024 5-year estimates
People.
4,534,824 residents in 1,814,469 households, next to the United States figure.
Source: U.S. Census Bureau, American Community Survey 2020–2024 5-year estimates
Homes.
2,023,116 housing units; the median owner-occupied home is valued at $205,600 (±$1,096).
When homes were built
Source: U.S. Census Bureau, American Community Survey 2020–2024 5-year estimates
Income and work.
Household income and work, in 2024 dollars; median household income ±$429.
The poverty rate uses the federal poverty thresholds, which vary with family size. It says nothing on its own about what a neighborhood is like to live in.
Source: U.S. Census Bureau, American Community Survey 2020–2024 5-year estimates
Getting around.
How workers aged 16 and over get to work, and how long it takes.
Source: U.S. Census Bureau, American Community Survey 2020–2024 5-year estimates
Internet.
Home internet subscriptions.
American Community Survey figures are estimates from a rolling sample, averaged over 2020–2024. Each comes with a margin of error, which is wider in places with fewer people.
Source: U.S. Census Bureau, American Community Survey 2020–2024 5-year estimates
Counties in Kentucky.
Every county has its own page, with all of its ZIP codes.