Friesland
Friesland has 664,222 residents in 18 municipalities. The average WOZ value of a home ranges from €263,000 in Harlingen to €456,000 in Terschelling. 62% of homes are owner-occupied.
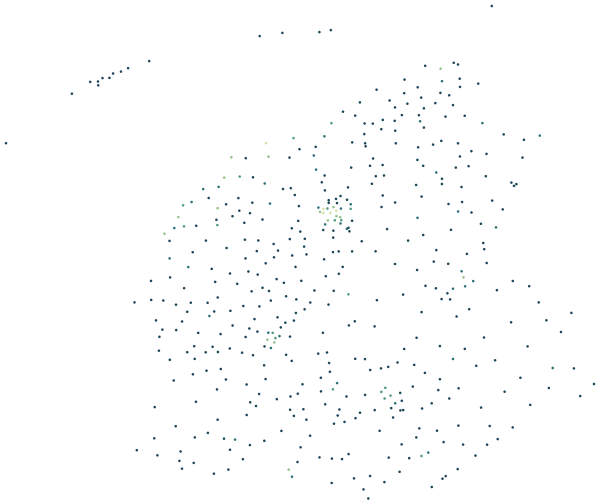
Sources: Statistics Netherlands (CBS), Statistics by postcode 2024 (CC BY 4.0) · © OpenStreetMap contributors (ODbL)
Friesland compared with the Netherlands.
Where Friesland stands among the 12 provinces.
By population Friesland is the 8th largest of the 12 provinces, home to 3.7% of the Dutch population. The average WOZ value of €303,000 is 24% below the national average of €398,000. Home ownership is higher than nationally: 62% against 57%. At 31.0 registered crimes per 1,000 residents, Friesland is below the national rate of 44.1. Within the province, Leeuwarden has the largest share of young people (15% aged 15–24) and Schiermonnikoog the largest share of over-65s (31%). Opsterland records the fewest crimes per resident (16.8 per 1,000). Vlieland is the greenest: on average 74% of the area within 500 metres of a home is green space.
| Measure | Friesland | Netherlands | Rank |
|---|---|---|---|
| Residents | 664,222 | 18,044,027 | 8th of 12 |
| Average WOZ value | €303,000 | €398,000 | 11th of 12 |
| Owner-occupied homes | 62% | 57% | 4th of 12 |
| Residents aged 15–24 | 12% | 12% | – |
| Residents aged 65+ | 23% | 21% | – |
| Green within 500 m | 38% | 26% | 1st of 12 |
| Crimes per 1,000 residents | 31.0 | 44.1 | 11th of 12 |
Ranks run from high to low: 1st is the province with the highest figure. Age shares are weighted by each municipality’s population; the national crime rate is the population-weighted average of the provinces.
Sources: Statistics Netherlands (CBS), Key figures for districts and neighbourhoods 2025 (CC BY 4.0) · Dutch Police, registered crime by district and neighbourhood, 2024–2025 (CC BY 4.0) · © OpenStreetMap contributors (ODbL)
All 18 municipalities at a glance.
Colour shows where each municipality sits among the others in Friesland.
| Municipality | Residents | WOZ value | Owner-occupied | Aged 15–24 | Aged 65+ | Green 500 m | Services 15 min | Crimes per 1,000 |
|---|---|---|---|---|---|---|---|---|
| Achtkarspelen | 28,200 | €294k | 64% | 13% | 22% | 44% | 13 | 19.1 |
| Ameland | 3,800 | €351k | 68% | 10% | 26% | 61% | 39 | 20.8 |
| Dantumadiel | 19,137 | €319k | 64% | 12% | 24% | 44% | 25 | 17.7 |
| De Fryske Marren | 52,235 | €363k | 70% | 11% | 26% | 40% | 20 | 21.0 |
| Harlingen | 16,210 | €263k | 56% | 11% | 28% | 22% | 78 | 27.6 |
| Heerenveen | 51,863 | €332k | 60% | 11% | 24% | 37% | 51 | 33.1 |
| Leeuwarden | 129,973 | €263k | 51% | 15% | 20% | 26% | 107 | 54.0 |
| Noardeast-Fryslân | 45,864 | €294k | 67% | 12% | 23% | 40% | 15 | 22.3 |
| Ooststellingwerf | 25,925 | €312k | 68% | 10% | 27% | 43% | 29 | 20.2 |
| Opsterland | 30,012 | €347k | 70% | 11% | 24% | 51% | 20 | 16.8 |
| Schiermonnikoog | 971 | €421k | 54% | 9% | 31% | 61% | 39 | 34.0 |
| Smallingerland | 57,084 | €291k | 60% | 12% | 23% | 32% | 74 | 36.9 |
| Súdwest-Fryslân | 90,534 | €317k | 65% | 11% | 25% | 42% | 35 | 29.8 |
| Terschelling | 4,923 | €456k | 64% | 13% | 25% | 64% | 43 | 22.1 |
| Tytsjerksteradiel | 32,821 | €318k | 72% | 12% | 25% | 46% | 17 | 19.1 |
| Vlieland | 1,217 | €426k | 38% | 13% | 22% | 74% | 48 | 41.9 |
| Waadhoeke | 46,857 | €269k | 68% | 11% | 24% | 33% | 17 | 22.9 |
| Weststellingwerf | 26,596 | €315k | 65% | 10% | 26% | 41% | 34 | 21.8 |
Sources: Statistics Netherlands (CBS), Key figures for districts and neighbourhoods 2025 (CC BY 4.0) · Dutch Police, registered crime by district and neighbourhood, 2024–2025 (CC BY 4.0) · © OpenStreetMap contributors (ODbL)
Municipalities in Friesland.
Every municipality has its own page with districts, neighbourhoods and postcodes.