Utrecht
Utrecht has 1,409,144 residents in 26 municipalities. The average WOZ value of a home ranges from €386,000 in Nieuwegein to €608,000 in De Bilt. 58% of homes are owner-occupied.
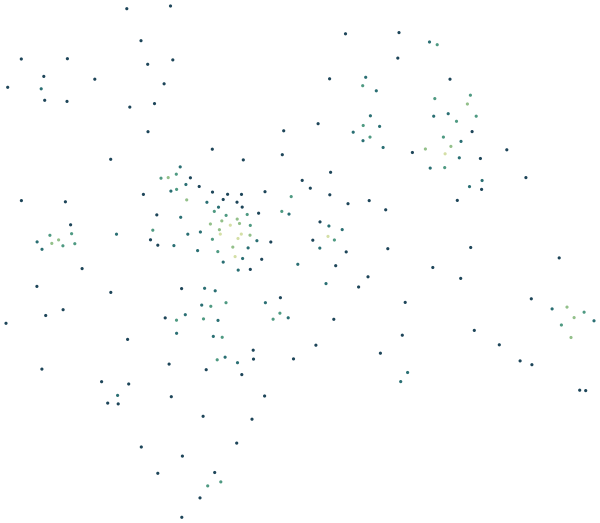
Sources: Statistics Netherlands (CBS), Statistics by postcode 2024 (CC BY 4.0) · © OpenStreetMap contributors (ODbL)
Utrecht compared with the Netherlands.
Where Utrecht stands among the 12 provinces.
By population Utrecht is the 5th largest of the 12 provinces, home to 7.8% of the Dutch population. The average WOZ value of €481,000 is 21% above the national average of €398,000. The share of owner-occupied homes (58%) is close to the national figure. Registered crime, at 44.4 per 1,000 residents, is close to the national level. Within the province, Utrecht has the largest share of young people (15% aged 15–24) and Utrechtse Heuvelrug the largest share of over-65s (26%). Wijk bij Duurstede records the fewest crimes per resident (18.3 per 1,000). Lopik is the greenest: on average 49% of the area within 500 metres of a home is green space.
| Measure | Utrecht | Netherlands | Rank |
|---|---|---|---|
| Residents | 1,409,144 | 18,044,027 | 5th of 12 |
| Average WOZ value | €481,000 | €398,000 | 1st of 12 |
| Owner-occupied homes | 58% | 57% | 9th of 12 |
| Residents aged 15–24 | 13% | 12% | – |
| Residents aged 65+ | 18% | 21% | – |
| Green within 500 m | 27% | 26% | 7th of 12 |
| Crimes per 1,000 residents | 44.4 | 44.1 | 4th of 12 |
Ranks run from high to low: 1st is the province with the highest figure. Age shares are weighted by each municipality’s population; the national crime rate is the population-weighted average of the provinces.
Sources: Statistics Netherlands (CBS), Key figures for districts and neighbourhoods 2025 (CC BY 4.0) · Dutch Police, registered crime by district and neighbourhood, 2024–2025 (CC BY 4.0) · © OpenStreetMap contributors (ODbL)
All 26 municipalities at a glance.
Colour shows where each municipality sits among the others in Utrecht.
| Municipality | Residents | WOZ value | Owner-occupied | Aged 15–24 | Aged 65+ | Green 500 m | Services 15 min | Crimes per 1,000 |
|---|---|---|---|---|---|---|---|---|
| Amersfoort | 163,298 | €446k | 58% | 12% | 17% | 20% | 150 | 44.2 |
| Baarn | 25,184 | €508k | 62% | 10% | 26% | 25% | 82 | 39.0 |
| Bunnik | 16,279 | €550k | 74% | 11% | 23% | 30% | 71 | 29.1 |
| Bunschoten | 22,684 | €463k | 73% | 13% | 18% | 28% | 111 | 24.8 |
| De Bilt | 43,792 | €608k | 61% | 11% | 25% | 31% | 67 | 36.8 |
| De Ronde Venen | 45,921 | €543k | 67% | 11% | 23% | 37% | 67 | 28.5 |
| Eemnes | 9,927 | €546k | 72% | 12% | 23% | 30% | 62 | 32.1 |
| Houten | 50,945 | €526k | 67% | 13% | 20% | 28% | 155 | 30.6 |
| IJsselstein | 33,339 | €458k | 64% | 13% | 20% | 26% | 109 | 31.7 |
| Leusden | 31,911 | €484k | 71% | 11% | 24% | 32% | 143 | 24.2 |
| Lopik | 14,800 | €483k | 75% | 13% | 19% | 49% | 23 | 18.9 |
| Montfoort | 13,772 | €479k | 74% | 13% | 22% | 35% | 70 | 18.9 |
| Nieuwegein | 66,788 | €386k | 58% | 11% | 22% | 22% | 118 | 54.8 |
| Oudewater | 10,355 | €441k | 69% | 11% | 23% | 37% | 66 | 22.9 |
| Renswoude | 5,782 | €514k | 74% | 13% | 17% | 34% | 37 | 22.7 |
| Rhenen | 20,392 | €461k | 65% | 12% | 23% | 33% | 60 | 26.5 |
| Soest | 47,999 | €477k | 64% | 11% | 24% | 25% | 66 | 29.4 |
| Stichtse Vecht | 66,130 | €506k | 65% | 11% | 23% | 32% | 78 | 38.4 |
| Utrecht | 376,757 | €490k | 45% | 15% | 11% | 22% | 264 | 73.0 |
| Utrechtse Heuvelrug | 50,945 | €549k | 65% | 11% | 26% | 42% | 53 | 26.7 |
| Veenendaal | 70,352 | €394k | 59% | 12% | 19% | 17% | 162 | 30.7 |
| Vijfheerenlanden | 62,554 | €404k | 63% | 11% | 21% | 34% | 86 | 28.6 |
| Wijk bij Duurstede | 23,831 | €456k | 70% | 11% | 24% | 32% | 114 | 18.3 |
| Woerden | 53,976 | €435k | 66% | 12% | 21% | 25% | 88 | 37.8 |
| Woudenberg | 14,760 | €505k | 71% | 12% | 19% | 34% | 50 | 24.5 |
| Zeist | 66,671 | €555k | 53% | 12% | 22% | 34% | 111 | 30.6 |
Sources: Statistics Netherlands (CBS), Key figures for districts and neighbourhoods 2025 (CC BY 4.0) · Dutch Police, registered crime by district and neighbourhood, 2024–2025 (CC BY 4.0) · © OpenStreetMap contributors (ODbL)
Municipalities in Utrecht.
Every municipality has its own page with districts, neighbourhoods and postcodes.