Gelderland
Gelderland has 2,161,358 residents in 51 municipalities. The average WOZ value of a home ranges from €312,000 in Winterswijk to €788,000 in Rozendaal. 61% of homes are owner-occupied.
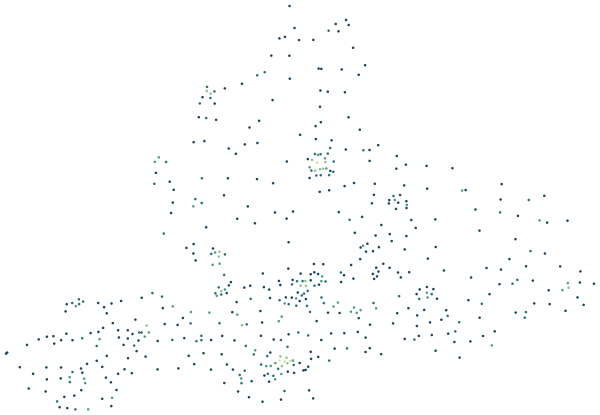
Sources: Statistics Netherlands (CBS), Statistics by postcode 2024 (CC BY 4.0) · © OpenStreetMap contributors (ODbL)
Gelderland compared with the Netherlands.
Where Gelderland stands among the 12 provinces.
By population Gelderland is the 4th largest of the 12 provinces, home to 12.0% of the Dutch population. The average WOZ value of €397,000 is close to the national average (€398,000). Home ownership is higher than nationally: 61% against 57%. At 35.1 registered crimes per 1,000 residents, Gelderland is below the national rate of 44.1. Within the province, Wageningen has the largest share of young people (23% aged 15–24) and Lochem the largest share of over-65s (30%). Bronckhorst records the fewest crimes per resident (14.1 per 1,000). Bronckhorst is the greenest: on average 45% of the area within 500 metres of a home is green space.
| Measure | Gelderland | Netherlands | Rank |
|---|---|---|---|
| Residents | 2,161,358 | 18,044,027 | 4th of 12 |
| Average WOZ value | €397,000 | €398,000 | 4th of 12 |
| Owner-occupied homes | 61% | 57% | 7th of 12 |
| Residents aged 15–24 | 12% | 12% | – |
| Residents aged 65+ | 22% | 21% | – |
| Green within 500 m | 30% | 26% | 4th of 12 |
| Crimes per 1,000 residents | 35.1 | 44.1 | 10th of 12 |
Ranks run from high to low: 1st is the province with the highest figure. Age shares are weighted by each municipality’s population; the national crime rate is the population-weighted average of the provinces.
Sources: Statistics Netherlands (CBS), Key figures for districts and neighbourhoods 2025 (CC BY 4.0) · Dutch Police, registered crime by district and neighbourhood, 2024–2025 (CC BY 4.0) · © OpenStreetMap contributors (ODbL)
All 51 municipalities at a glance.
Colour shows where each municipality sits among the others in Gelderland.
| Municipality | Residents | WOZ value | Owner-occupied | Aged 15–24 | Aged 65+ | Green 500 m | Services 15 min | Crimes per 1,000 |
|---|---|---|---|---|---|---|---|---|
| Aalten | 27,466 | €344k | 72% | 11% | 25% | 29% | 76 | 17.6 |
| Apeldoorn | 168,551 | €386k | 60% | 12% | 23% | 25% | 112 | 44.4 |
| Arnhem | 169,364 | €350k | 43% | 13% | 17% | 28% | 108 | 66.2 |
| Barneveld | 63,152 | €480k | 68% | 13% | 18% | 31% | 75 | 24.5 |
| Berg en Dal | 35,558 | €395k | 61% | 10% | 27% | 39% | 21 | 30.1 |
| Berkelland | 43,917 | €385k | 69% | 11% | 27% | 35% | 42 | 22.3 |
| Beuningen | 26,749 | €416k | 71% | 10% | 23% | 22% | 53 | 26.7 |
| Bronckhorst | 36,012 | €443k | 71% | 11% | 29% | 45% | 15 | 14.1 |
| Brummen | 21,394 | €391k | 63% | 10% | 27% | 33% | 51 | 24.9 |
| Buren | 27,978 | €473k | 75% | 11% | 22% | 34% | 20 | 21.9 |
| Culemborg | 30,281 | €419k | 64% | 11% | 21% | 26% | 117 | 32.9 |
| Doesburg | 11,125 | €318k | 54% | 10% | 29% | 36% | 75 | 27.3 |
| Doetinchem | 60,049 | €331k | 60% | 12% | 23% | 32% | 70 | 38.0 |
| Druten | 19,748 | €393k | 65% | 11% | 22% | 30% | 85 | 21.8 |
| Duiven | 24,942 | €370k | 67% | 12% | 23% | 23% | 73 | 30.1 |
| Ede | 124,214 | €438k | 65% | 13% | 20% | 25% | 114 | 35.4 |
| Elburg | 23,903 | €393k | 65% | 12% | 21% | 42% | 53 | 23.0 |
| Epe | 33,469 | €459k | 65% | 10% | 27% | 41% | 42 | 22.9 |
| Ermelo | 28,131 | €456k | 62% | 12% | 25% | 35% | 90 | 28.6 |
| Harderwijk | 50,042 | €405k | 59% | 12% | 20% | 26% | 92 | 38.9 |
| Hattem | 12,745 | €444k | 67% | 11% | 23% | 40% | 64 | 17.3 |
| Heerde | 19,305 | €449k | 69% | 11% | 26% | 41% | 48 | 19.7 |
| Heumen | 16,861 | €456k | 71% | 11% | 27% | 31% | 55 | 31.2 |
| Lingewaard | 47,684 | €415k | 73% | 12% | 24% | 28% | 69 | 21.6 |
| Lochem | 34,316 | €466k | 71% | 10% | 30% | 42% | 20 | 21.2 |
| Maasdriel | 26,289 | €461k | 72% | 11% | 21% | 28% | 37 | 24.1 |
| Montferland | 36,996 | €322k | 67% | 11% | 25% | 29% | 41 | 19.4 |
| Neder-Betuwe | 25,781 | €393k | 66% | 13% | 18% | 24% | 32 | 22.4 |
| Nijkerk | 45,720 | €490k | 70% | 12% | 20% | 24% | 76 | 22.9 |
| Nijmegen | 189,007 | €387k | 44% | 17% | 17% | 20% | 119 | 62.8 |
| Nunspeet | 29,393 | €451k | 66% | 12% | 22% | 33% | 36 | 28.5 |
| Oldebroek | 24,417 | €396k | 70% | 12% | 21% | 42% | 32 | 18.5 |
| Oost Gelre | 30,048 | €341k | 75% | 11% | 25% | 33% | 65 | 19.3 |
| Oude IJsselstreek | 39,499 | €343k | 67% | 11% | 26% | 32% | 29 | 19.2 |
| Overbetuwe | 48,945 | €422k | 68% | 12% | 22% | 24% | 50 | 27.7 |
| Putten | 24,953 | €517k | 67% | 12% | 22% | 35% | 72 | 22.8 |
| Renkum | 31,490 | €440k | 63% | 9% | 30% | 38% | 63 | 31.4 |
| Rheden | 43,782 | €377k | 56% | 11% | 27% | 27% | 87 | 34.1 |
| Rozendaal | 1,836 | €788k | 89% | 12% | 23% | 44% | 71 | 34.9 |
| Scherpenzeel | 10,539 | €442k | 73% | 12% | 20% | 29% | 72 | 15.1 |
| Tiel | 42,575 | €358k | 57% | 12% | 20% | 24% | 114 | 45.8 |
| Voorst | 25,567 | €459k | 68% | 11% | 26% | 44% | 30 | 26.0 |
| Wageningen | 42,790 | €362k | 43% | 23% | 17% | 27% | 159 | 31.7 |
| West Betuwe | 53,253 | €466k | 73% | 12% | 21% | 35% | 23 | 25.7 |
| West Maas en Waal | 20,594 | €435k | 72% | 10% | 23% | 34% | 19 | 19.7 |
| Westervoort | 15,205 | €333k | 60% | 10% | 24% | 27% | 61 | 23.8 |
| Wijchen | 41,836 | €397k | 68% | 12% | 24% | 29% | 59 | 29.7 |
| Winterswijk | 29,232 | €312k | 70% | 11% | 26% | 28% | 64 | 26.1 |
| Zaltbommel | 30,412 | €404k | 67% | 13% | 19% | 30% | 23 | 36.5 |
| Zevenaar | 45,215 | €334k | 64% | 10% | 25% | 29% | 54 | 26.7 |
| Zutphen | 49,028 | €334k | 57% | 11% | 25% | 33% | 118 | 44.0 |
Sources: Statistics Netherlands (CBS), Key figures for districts and neighbourhoods 2025 (CC BY 4.0) · Dutch Police, registered crime by district and neighbourhood, 2024–2025 (CC BY 4.0) · © OpenStreetMap contributors (ODbL)
Municipalities in Gelderland.
Every municipality has its own page with districts, neighbourhoods and postcodes.