North Brabant
North Brabant has 2,664,047 residents in 56 municipalities. The average WOZ value of a home ranges from €323,000 in Roosendaal to €568,000 in Vught. 61% of homes are owner-occupied.
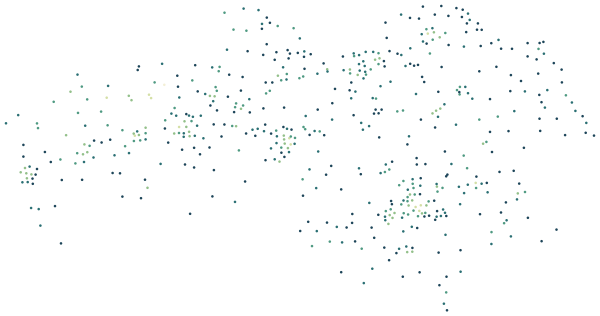
Sources: Statistics Netherlands (CBS), Statistics by postcode 2024 (CC BY 4.0) · © OpenStreetMap contributors (ODbL)
North Brabant compared with the Netherlands.
Where North Brabant stands among the 12 provinces.
By population North Brabant is the 3rd largest of the 12 provinces, home to 14.8% of the Dutch population. The average WOZ value of €405,000 is close to the national average (€398,000). Home ownership is higher than nationally: 61% against 57%. Registered crime, at 43.4 per 1,000 residents, is close to the national level. Within the province, Tilburg has the largest share of young people (15% aged 15–24) and Baarle-Nassau the largest share of over-65s (28%). Sint-Michielsgestel records the fewest crimes per resident (20.7 per 1,000). Alphen-Chaam is the greenest: on average 39% of the area within 500 metres of a home is green space.
| Measure | North Brabant | Netherlands | Rank |
|---|---|---|---|
| Residents | 2,664,047 | 18,044,027 | 3rd of 12 |
| Average WOZ value | €405,000 | €398,000 | 3rd of 12 |
| Owner-occupied homes | 61% | 57% | 6th of 12 |
| Residents aged 15–24 | 12% | 12% | – |
| Residents aged 65+ | 22% | 21% | – |
| Green within 500 m | 24% | 26% | 10th of 12 |
| Crimes per 1,000 residents | 43.4 | 44.1 | 5th of 12 |
Ranks run from high to low: 1st is the province with the highest figure. Age shares are weighted by each municipality’s population; the national crime rate is the population-weighted average of the provinces.
Sources: Statistics Netherlands (CBS), Key figures for districts and neighbourhoods 2025 (CC BY 4.0) · Dutch Police, registered crime by district and neighbourhood, 2024–2025 (CC BY 4.0) · © OpenStreetMap contributors (ODbL)
All 56 municipalities at a glance.
Colour shows where each municipality sits among the others in North Brabant.
| Municipality | Residents | WOZ value | Owner-occupied | Aged 15–24 | Aged 65+ | Green 500 m | Services 15 min | Crimes per 1,000 |
|---|---|---|---|---|---|---|---|---|
| Alphen-Chaam | 10,539 | €477k | 75% | 10% | 26% | 39% | 42 | 28.6 |
| Altena | 58,726 | €401k | 69% | 12% | 21% | 25% | 27 | 26.1 |
| Asten | 17,385 | €442k | 71% | 11% | 24% | 23% | 42 | 29.4 |
| Baarle-Nassau | 7,205 | €418k | 70% | 10% | 28% | 31% | 84 | 31.5 |
| Bergeijk | 19,263 | €477k | 78% | 11% | 25% | 32% | 14 | 22.5 |
| Bergen op Zoom | 70,194 | €333k | 60% | 11% | 23% | 24% | 91 | 53.5 |
| Bernheze | 32,606 | €479k | 71% | 12% | 23% | 26% | 34 | 27.7 |
| Best | 31,652 | €464k | 71% | 11% | 21% | 20% | 100 | 37.2 |
| Bladel | 21,006 | €445k | 74% | 11% | 24% | 23% | 52 | 27.6 |
| Boekel | 11,465 | €437k | 74% | 12% | 21% | 18% | 57 | 26.3 |
| Boxtel | 34,241 | €399k | 63% | 12% | 24% | 27% | 50 | 35.1 |
| Breda | 188,779 | €419k | 55% | 14% | 20% | 21% | 93 | 59.8 |
| Cranendonck | 21,665 | €393k | 73% | 11% | 26% | 24% | 22 | 34.3 |
| Deurne | 33,387 | €423k | 67% | 11% | 24% | 26% | 28 | 28.7 |
| Dongen | 27,495 | €377k | 70% | 11% | 23% | 21% | 72 | 25.1 |
| Drimmelen | 28,295 | €416k | 72% | 10% | 24% | 26% | 40 | 25.7 |
| Eersel | 20,389 | €477k | 74% | 10% | 25% | 29% | 24 | 30.3 |
| Eindhoven | 249,035 | €391k | 44% | 15% | 16% | 19% | 136 | 75.1 |
| Etten-Leur | 45,457 | €377k | 64% | 11% | 22% | 17% | 78 | 34.8 |
| Geertruidenberg | 21,944 | €364k | 62% | 11% | 23% | 23% | 70 | 26.0 |
| Geldrop-Mierlo | 40,754 | €416k | 65% | 11% | 24% | 26% | 82 | 35.3 |
| Gemert-Bakel | 31,541 | €427k | 69% | 11% | 22% | 26% | 34 | 28.6 |
| Gilze en Rijen | 28,531 | €388k | 65% | 12% | 22% | 22% | 70 | 40.1 |
| Goirle | 24,468 | €442k | 71% | 11% | 25% | 20% | 89 | 28.9 |
| Halderberge | 31,347 | €381k | 66% | 11% | 25% | 23% | 51 | 34.2 |
| Heeze-Leende | 17,075 | €503k | 78% | 10% | 26% | 34% | 34 | 26.5 |
| Helmond | 96,551 | €345k | 54% | 12% | 19% | 25% | 71 | 46.2 |
| 's-Hertogenbosch | 161,530 | €417k | 53% | 11% | 20% | 23% | 119 | 55.9 |
| Heusden | 46,365 | €442k | 68% | 11% | 22% | 23% | 73 | 25.8 |
| Hilvarenbeek | 16,149 | €481k | 75% | 11% | 25% | 27% | 28 | 44.3 |
| Laarbeek | 23,324 | €439k | 70% | 11% | 25% | 24% | 28 | 23.5 |
| Land van Cuijk | 92,817 | €394k | 69% | 11% | 25% | 29% | 31 | 30.3 |
| Loon op Zand | 24,151 | €405k | 66% | 11% | 24% | 26% | 61 | 31.9 |
| Maashorst | 59,671 | €423k | 65% | 11% | 23% | 26% | 83 | 45.3 |
| Meierijstad | 84,711 | €449k | 69% | 11% | 23% | 23% | 59 | 31.4 |
| Moerdijk | 38,273 | €369k | 67% | 11% | 24% | 18% | 32 | 36.2 |
| Nuenen, Gerwen en Nederwetten | 24,290 | €513k | 75% | 10% | 27% | 17% | 90 | 26.9 |
| Oirschot | 19,536 | €504k | 75% | 11% | 25% | 28% | 30 | 29.7 |
| Oisterwijk | 33,108 | €515k | 69% | 11% | 26% | 24% | 65 | 33.2 |
| Oosterhout | 58,380 | €387k | 61% | 10% | 24% | 24% | 92 | 33.0 |
| Oss | 95,239 | €383k | 63% | 11% | 21% | 24% | 66 | 44.4 |
| Reusel-De Mierden | 13,653 | €445k | 76% | 10% | 24% | 22% | 44 | 24.7 |
| Roosendaal | 77,721 | €323k | 62% | 11% | 23% | 22% | 66 | 53.0 |
| Rucphen | 23,995 | €401k | 67% | 10% | 24% | 25% | 29 | 39.4 |
| Sint-Michielsgestel | 30,176 | €492k | 75% | 11% | 23% | 30% | 41 | 20.7 |
| Someren | 20,200 | €436k | 73% | 10% | 23% | 24% | 41 | 25.2 |
| Son en Breugel | 18,131 | €517k | 75% | 11% | 22% | 38% | 49 | 37.2 |
| Steenbergen | 24,567 | €362k | 70% | 10% | 24% | 19% | 44 | 30.3 |
| Tilburg | 230,357 | €339k | 50% | 15% | 18% | 22% | 111 | 57.7 |
| Valkenswaard | 31,955 | €419k | 61% | 10% | 27% | 23% | 73 | 31.5 |
| Veldhoven | 47,601 | €480k | 67% | 10% | 23% | 18% | 132 | 31.7 |
| Vught | 33,010 | €568k | 65% | 10% | 23% | 29% | 85 | 30.1 |
| Waalre | 17,898 | €531k | 74% | 10% | 25% | 31% | 53 | 27.1 |
| Waalwijk | 51,241 | €377k | 61% | 11% | 22% | 23% | 72 | 36.5 |
| Woensdrecht | 22,194 | €367k | 72% | 10% | 26% | 29% | 27 | 32.4 |
| Zundert | 22,809 | €458k | 75% | 10% | 25% | 26% | 35 | 26.2 |
Sources: Statistics Netherlands (CBS), Key figures for districts and neighbourhoods 2025 (CC BY 4.0) · Dutch Police, registered crime by district and neighbourhood, 2024–2025 (CC BY 4.0) · © OpenStreetMap contributors (ODbL)
Municipalities in North Brabant.
Every municipality has its own page with districts, neighbourhoods and postcodes.