North Holland
North Holland has 2,992,016 residents in 44 municipalities. The average WOZ value of a home ranges from €261,000 in Den Helder to €920,000 in Laren (NH.). 50% of homes are owner-occupied.
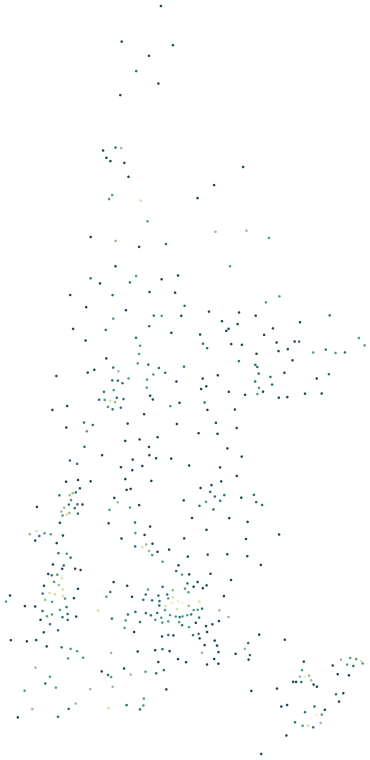
Sources: Statistics Netherlands (CBS), Statistics by postcode 2024 (CC BY 4.0) · © OpenStreetMap contributors (ODbL)
North Holland compared with the Netherlands.
Where North Holland stands among the 12 provinces.
By population North Holland is the 2nd largest of the 12 provinces, home to 16.6% of the Dutch population. The average WOZ value of €481,000 is 21% above the national average of €398,000. Home ownership is lower than nationally: 50% against 57%. At 54.2 registered crimes per 1,000 residents, North Holland is above the national rate of 44.1. Within the province, Diemen has the largest share of young people (15% aged 15–24) and Bergen (NH.) the largest share of over-65s (35%). Opmeer records the fewest crimes per resident (20.3 per 1,000). Wormerland is the greenest: on average 55% of the area within 500 metres of a home is green space.
| Measure | North Holland | Netherlands | Rank |
|---|---|---|---|
| Residents | 2,992,016 | 18,044,027 | 2nd of 12 |
| Average WOZ value | €481,000 | €398,000 | 2nd of 12 |
| Owner-occupied homes | 50% | 57% | 12th of 12 |
| Residents aged 15–24 | 12% | 12% | – |
| Residents aged 65+ | 19% | 21% | – |
| Green within 500 m | 25% | 26% | 8th of 12 |
| Crimes per 1,000 residents | 54.2 | 44.1 | 1st of 12 |
Ranks run from high to low: 1st is the province with the highest figure. Age shares are weighted by each municipality’s population; the national crime rate is the population-weighted average of the provinces.
Sources: Statistics Netherlands (CBS), Key figures for districts and neighbourhoods 2025 (CC BY 4.0) · Dutch Police, registered crime by district and neighbourhood, 2024–2025 (CC BY 4.0) · © OpenStreetMap contributors (ODbL)
All 44 municipalities at a glance.
Colour shows where each municipality sits among the others in North Holland.
| Municipality | Residents | WOZ value | Owner-occupied | Aged 15–24 | Aged 65+ | Green 500 m | Services 15 min | Crimes per 1,000 |
|---|---|---|---|---|---|---|---|---|
| Aalsmeer | 33,250 | €526k | 64% | 13% | 19% | 12% | 78 | 30.9 |
| Alkmaar | 112,896 | €380k | 59% | 11% | 21% | 24% | 127 | 51.3 |
| Amstelveen | 95,822 | €568k | 48% | 13% | 20% | 27% | 165 | 38.3 |
| Amsterdam | 934,526 | €518k | 31% | 13% | 14% | 23% | 331 | 85.6 |
| Bergen (NH.) | 29,722 | €612k | 68% | 10% | 35% | 41% | 53 | 32.9 |
| Beverwijk | 43,040 | €356k | 54% | 11% | 19% | 20% | 209 | 43.1 |
| Blaricum | 12,947 | €904k | 70% | 9% | 24% | 31% | 67 | 23.6 |
| Bloemendaal | 23,592 | €919k | 71% | 11% | 28% | 38% | 86 | 40.6 |
| Castricum | 36,618 | €508k | 75% | 11% | 27% | 27% | 71 | 28.3 |
| Den Helder | 56,662 | €261k | 56% | 11% | 25% | 24% | 101 | 55.2 |
| Diemen | 33,228 | €460k | 40% | 15% | 16% | 37% | 246 | 50.1 |
| Dijk en Waard | 90,747 | €414k | 71% | 12% | 20% | 20% | 90 | 36.9 |
| Drechterland | 20,476 | €423k | 74% | 12% | 23% | 28% | 49 | 22.4 |
| Edam-Volendam | 37,140 | €428k | 77% | 12% | 23% | 33% | 78 | 21.6 |
| Enkhuizen | 18,847 | €332k | 62% | 11% | 23% | 19% | 87 | 41.3 |
| Gooise Meren | 61,003 | €595k | 64% | 10% | 21% | 24% | 102 | 41.5 |
| Haarlem | 168,743 | €505k | 53% | 10% | 18% | 17% | 188 | 55.1 |
| Haarlemmermeer | 165,255 | €499k | 67% | 13% | 18% | 22% | 149 | 43.4 |
| Heemskerk | 39,380 | €412k | 60% | 11% | 24% | 23% | 171 | 30.0 |
| Heemstede | 27,638 | €680k | 66% | 9% | 28% | 25% | 122 | 38.6 |
| Heiloo | 24,341 | €544k | 74% | 11% | 28% | 26% | 59 | 24.9 |
| Hilversum | 94,393 | €477k | 54% | 11% | 19% | 19% | 136 | 42.9 |
| Hollands Kroon | 49,982 | €369k | 71% | 12% | 23% | 25% | 23 | 21.7 |
| Hoorn | 76,036 | €365k | 61% | 12% | 21% | 25% | 193 | 49.6 |
| Huizen | 41,196 | €477k | 59% | 11% | 27% | 21% | 113 | 27.0 |
| Koggenland | 23,821 | €416k | 79% | 12% | 22% | 34% | 28 | 23.6 |
| Landsmeer | 11,745 | €593k | 66% | 11% | 24% | 43% | 118 | 34.7 |
| Laren (NH.) | 11,474 | €920k | 68% | 9% | 33% | 24% | 96 | 36.5 |
| Medemblik | 45,934 | €409k | 70% | 12% | 23% | 30% | 29 | 23.0 |
| Oostzaan | 9,733 | €522k | 67% | 11% | 23% | 35% | 40 | 46.0 |
| Opmeer | 12,491 | €398k | 74% | 12% | 23% | 35% | 40 | 20.3 |
| Ouder-Amstel | 14,532 | €595k | 56% | 12% | 22% | 34% | 74 | 75.1 |
| Purmerend | 95,912 | €407k | 60% | 11% | 22% | 27% | 166 | 34.3 |
| Schagen | 48,378 | €372k | 70% | 12% | 26% | 26% | 36 | 34.5 |
| Stede Broec | 22,253 | €371k | 70% | 11% | 24% | 23% | 92 | 29.3 |
| Texel | 13,846 | €406k | 65% | 9% | 28% | 38% | 29 | 31.3 |
| Uitgeest | 13,427 | €462k | 72% | 12% | 21% | 35% | 101 | 35.5 |
| Uithoorn | 32,115 | €454k | 60% | 11% | 19% | 22% | 87 | 32.4 |
| Velsen | 70,026 | €408k | 57% | 11% | 22% | 26% | 109 | 39.1 |
| Waterland | 17,556 | €483k | 70% | 11% | 27% | 45% | 46 | 23.8 |
| Wijdemeren | 24,670 | €576k | 70% | 10% | 26% | 51% | 60 | 21.6 |
| Wormerland | 16,421 | €441k | 63% | 12% | 24% | 55% | 90 | 23.7 |
| Zaanstad | 162,828 | €389k | 54% | 11% | 19% | 26% | 113 | 46.0 |
| Zandvoort | 17,374 | €476k | 54% | 9% | 28% | 27% | 129 | 62.0 |
Sources: Statistics Netherlands (CBS), Key figures for districts and neighbourhoods 2025 (CC BY 4.0) · Dutch Police, registered crime by district and neighbourhood, 2024–2025 (CC BY 4.0) · © OpenStreetMap contributors (ODbL)
Municipalities in North Holland.
Every municipality has its own page with districts, neighbourhoods and postcodes.