Bas-Rhin
Bas-Rhin has 1,156,963 residents in 514 communes. 56% of households own their main home.
Three maps of Bas-Rhin.
Each commune is coloured by its value; every map uses the same colour scale, from lowest to highest. Grey: not published.
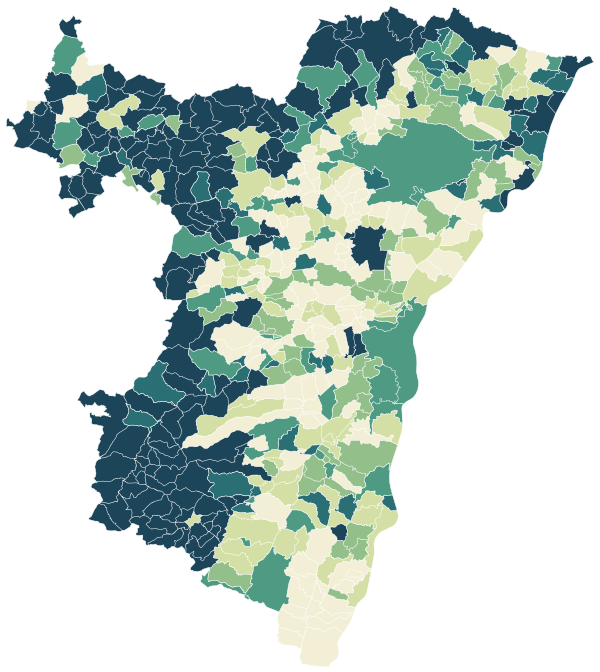
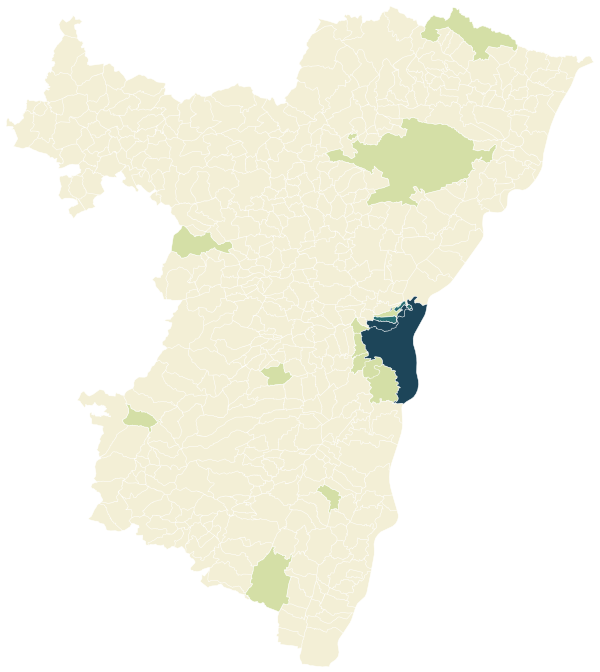
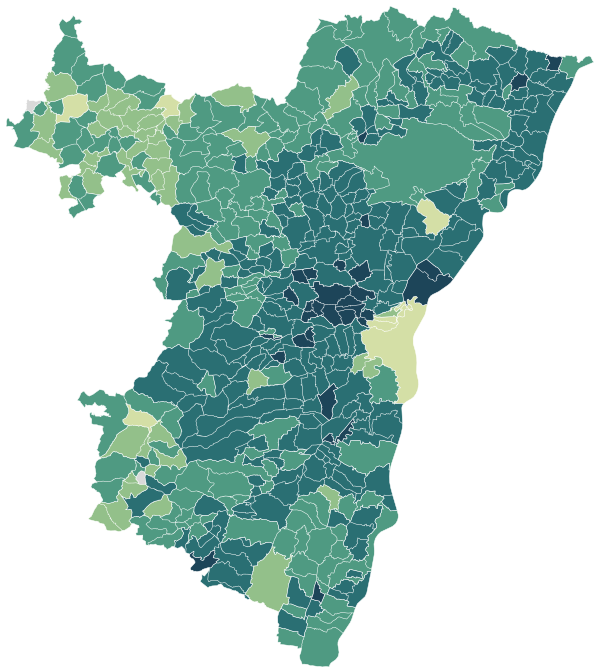
Sources: IGN and Insee, IRIS boundaries and Admin Express 2024 (Open Licence 2.0) · DGFiP property sales (DVF), data.gouv.fr statistics (Open Licence 2.0) · Insee, Filosofi 2021 income data (Open Licence 2.0) · © OpenStreetMap contributors (ODbL)
The 99 communes with more than 2,000 people.
Colour shows where each commune sits among the others in the table, from lowest to highest.
| Commune | Residents | Living standard | Home owners | Aged 75+ | Unemployment | Green 500 m | Services 15 min |
|---|---|---|---|---|---|---|---|
| Achenheim | 2,570 | €28,520 | 74% | 10% | 5.6% | 9% | 23 |
| Barr | 7,086 | €24,020 | 59% | 10% | 11.2% | 55% | 34 |
| Benfeld | 5,922 | €22,820 | 57% | 10% | 8.2% | 6% | 77 |
| Berstett | 2,474 | €28,210 | 81% | 8% | 5.4% | 13% | 6 |
| Betschdorf | 4,212 | €24,510 | 75% | 10% | 7.0% | 13% | 20 |
| Bischheim | 18,289 | €19,700 | 36% | 8% | 14.0% | 10% | 204 |
| Bischoffsheim | 3,360 | €27,930 | 71% | 10% | 6.5% | 0% | 11 |
| Bischwiller | 12,211 | €20,610 | 55% | 10% | 16.5% | 13% | 38 |
| Bouxwiller | 3,706 | €23,290 | 72% | 11% | 12.1% | 10% | 49 |
| Brumath | 10,369 | €25,700 | 58% | 11% | 7.9% | 36% | 9 |
| Bœrsch | 2,435 | €27,660 | 76% | 10% | 6.1% | 1% | 12 |
| Châtenois | 4,265 | €25,790 | 72% | 9% | 6.5% | 7% | 38 |
| Dambach-la-Ville | 2,186 | €25,480 | 70% | 10% | 4.6% | 5% | 22 |
| Dettwiller | 2,569 | €24,000 | 75% | 11% | 7.4% | 18% | 25 |
| Dorlisheim | 2,626 | €25,820 | 70% | 16% | 6.5% | 1% | 46 |
| Drusenheim | 5,357 | €25,990 | 75% | 10% | 8.4% | 3% | 42 |
| Duttlenheim | 2,957 | €27,120 | 81% | 9% | 4.8% | 0% | 23 |
| Ebersheim | 2,295 | €25,220 | 73% | 8% | 5.9% | 5% | 13 |
| Eckbolsheim | 7,237 | €25,540 | 58% | 9% | 9.4% | 31% | 70 |
| Entzheim | 2,545 | €26,100 | 69% | 6% | 8.5% | 4% | 29 |
| Epfig | 2,239 | €26,440 | 75% | 10% | 5.4% | 1% | 16 |
| Erstein | 11,076 | €23,340 | 55% | 9% | 10.7% | 13% | 44 |
| Eschau | 5,847 | €27,100 | 70% | 8% | 6.4% | 16% | 39 |
| Fegersheim | 5,769 | €26,570 | 65% | 9% | 7.3% | 14% | 54 |
| Gambsheim | 5,263 | €26,460 | 73% | 9% | 6.4% | 3% | 44 |
| Geispolsheim | 7,759 | €25,970 | 66% | 10% | 8.6% | 13% | 24 |
| Gerstheim | 3,457 | €26,200 | 81% | 10% | 7.1% | 17% | 41 |
| Geudertheim | 2,719 | €27,080 | 78% | 8% | 4.3% | 15% | 20 |
| Gries | 2,886 | €27,290 | 84% | 9% | 7.9% | 1% | 23 |
| Griesheim-près-Molsheim | 2,341 | €28,620 | 78% | 7% | 4.4% | 2% | 14 |
| Gundershoffen | 3,808 | €24,180 | 75% | 8% | 9.7% | 8% | 22 |
| Haguenau | 36,070 | €23,110 | 53% | 9% | 10.9% | 17% | 78 |
| Herrlisheim | 4,701 | €26,270 | 81% | 11% | 7.1% | 2% | 44 |
| Hilsenheim | 2,615 | €25,390 | 78% | 10% | 5.7% | 3% | 16 |
| Hochfelden | 4,039 | €25,780 | 70% | 10% | 6.3% | 2% | 51 |
| Holtzheim | 3,890 | €26,950 | 66% | 9% | 6.7% | 9% | 19 |
| Huttenheim | 2,694 | €24,860 | 77% | 8% | 9.2% | 23% | 23 |
| Hœnheim | 11,413 | €22,500 | 60% | 12% | 13.8% | 7% | 97 |
| Hœrdt | 4,557 | €27,680 | 72% | 9% | 5.7% | 4% | 52 |
| Illkirch-Graffenstaden | 27,339 | €24,190 | 45% | 10% | 10.9% | 16% | 90 |
| Ingwiller | 3,993 | €22,600 | 68% | 13% | 11.4% | 10% | 46 |
| Ittenheim | 2,081 | €27,430 | 72% | 9% | 6.3% | 1% | 16 |
| Kaltenhouse | 2,443 | €25,430 | 79% | 7% | 9.9% | 21% | 28 |
| Kilstett | 2,548 | €29,140 | 82% | 8% | 4.7% | 3% | 18 |
| La Broque | 2,577 | €22,310 | 73% | 11% | 11.1% | 45% | 40 |
| La Wantzenau | 5,879 | €30,220 | 75% | 12% | 4.8% | 10% | 7 |
| Lampertheim | 3,475 | €29,820 | 70% | 10% | 6.6% | 13% | 36 |
| Lauterbourg | 2,336 | €23,910 | 50% | 12% | 9.4% | 50% | 53 |
| Lingolsheim | 20,683 | €22,260 | 59% | 9% | 11.5% | 14% | 68 |
| Lipsheim | 2,692 | €28,160 | 73% | 8% | 6.2% | 2% | 37 |
| Marckolsheim | 4,384 | €23,300 | 58% | 10% | 10.8% | 2% | 43 |
| Marlenheim | 4,200 | €25,500 | 67% | 12% | 7.9% | 11% | 28 |
| Marmoutier | 2,703 | €22,880 | 70% | 9% | 9.0% | 4% | 26 |
| Mertzwiller | 3,367 | €23,880 | 80% | 10% | 8.4% | 20% | 25 |
| Mittelhausbergen | 2,075 | €31,010 | 64% | 12% | 7.3% | 2% | 41 |
| Molsheim | 9,328 | €23,840 | 48% | 10% | 10.8% | 12% | 70 |
| Mommenheim | 2,251 | €26,480 | 68% | 10% | 6.7% | 7% | 23 |
| Mundolsheim | 5,236 | €27,220 | 69% | 10% | 7.6% | 6% | 48 |
| Muttersholtz | 2,288 | €24,340 | 80% | 8% | 9.0% | 2% | 12 |
| Mutzig | 6,101 | €22,390 | 51% | 8% | 11.5% | 48% | 59 |
| Niederbronn-les-Bains | 4,372 | €23,600 | 66% | 13% | 11.1% | 17% | 53 |
| Oberhausbergen | 5,652 | €26,410 | 51% | 13% | 8.0% | 4% | 64 |
| Oberhoffen-sur-Moder | 3,878 | €25,810 | 78% | 7% | 4.6% | 1% | 23 |
| Obernai | 12,303 | €24,080 | 44% | 13% | 9.9% | 21% | 40 |
| Oberschaeffolsheim | 2,578 | €27,610 | 71% | 11% | 7.3% | 2% | 25 |
| Offendorf | 2,481 | €27,610 | 85% | 8% | 4.3% | 7% | 17 |
| Ostwald | 13,492 | €22,150 | 47% | 9% | 13.5% | 15% | 69 |
| Plobsheim | 4,471 | €27,380 | 72% | 9% | 5.5% | 7% | 17 |
| Reichshoffen | 5,407 | €22,940 | 75% | 11% | 13.6% | 64% | 9 |
| Reichstett | 4,554 | €25,920 | 67% | 14% | 9.4% | 12% | 39 |
| Rhinau | 2,699 | €23,780 | 73% | 12% | 8.2% | 10% | 31 |
| Rosheim | 5,409 | €27,230 | 68% | 12% | 5.4% | 6% | 32 |
| Rountzenheim-Auenheim | 2,000 | €27,180 | 86% | 7% | 5.0% | 14% | 10 |
| Rœschwoog | 2,273 | €27,140 | 80% | 8% | 6.5% | 4% | 28 |
| Sarre-Union | 2,751 | €19,710 | 60% | 13% | 13.1% | 0% | 28 |
| Saverne | 11,323 | €22,330 | 53% | 12% | 11.4% | 20% | 68 |
| Scherwiller | 3,121 | €26,360 | 76% | 10% | 5.9% | 6% | 14 |
| Schiltigheim | 34,382 | €19,660 | 34% | 8% | 16.4% | 17% | 270 |
| Schirmeck | 2,081 | €20,940 | 52% | 16% | 11.2% | 24% | 64 |
| Schirrhein | 2,263 | €27,310 | 87% | 9% | 6.8% | 28% | 16 |
| Schweighouse-sur-Moder | 5,116 | €24,870 | 70% | 10% | 7.5% | 23% | 45 |
| Seltz | 3,168 | €25,520 | 66% | 8% | 5.2% | 42% | 25 |
| Sessenheim | 2,309 | €26,300 | 86% | 8% | 7.1% | 3% | 15 |
| Souffelweyersheim | 8,182 | €26,470 | 62% | 10% | 7.6% | 6% | 58 |
| Soufflenheim | 4,775 | €24,150 | 74% | 10% | 9.4% | 12% | 38 |
| Soultz-sous-Forêts | 3,125 | €24,090 | 68% | 11% | 9.6% | 11% | 42 |
| Strasbourg | 291,709 | €20,260 | 27% | 7% | 15.9% | 16% | 352 |
| Sélestat | 19,523 | €22,650 | 47% | 9% | 11.3% | 18% | 94 |
| Truchtersheim | 4,328 | €30,030 | 77% | 12% | 4.9% | 1% | 31 |
| Val-de-Moder | 5,047 | €23,740 | 70% | 10% | 10.2% | 2% | 41 |
| Vendenheim | 6,005 | €26,160 | 68% | 11% | 9.2% | 13% | 20 |
| Wasselonne | 5,777 | €23,380 | 63% | 11% | 7.7% | 49% | 14 |
| Weitbruch | 2,721 | €26,510 | 87% | 9% | 6.6% | 0% | 15 |
| Weyersheim | 3,515 | €26,910 | 79% | 9% | 6.5% | 10% | 27 |
| Wingersheim les Quatre Bans | 2,340 | €27,750 | 83% | 9% | 5.1% | 4% | 15 |
| Wisches | 2,061 | €23,310 | 75% | 9% | 6.8% | 36% | 23 |
| Wissembourg | 7,541 | €23,000 | 52% | 12% | 9.6% | 58% | 65 |
| Wittisheim | 2,086 | €24,710 | 83% | 8% | 6.1% | 10% | 4 |
| Wolfisheim | 4,191 | €26,060 | 59% | 9% | 8.2% | 34% | 55 |
Sources: Insee, 2022 population census (sub-municipal files, Open Licence 2.0) · DGFiP property sales (DVF), data.gouv.fr statistics (Open Licence 2.0) · Insee, Filosofi 2021 income data (Open Licence 2.0) · © OpenStreetMap contributors (ODbL)
People.
1,156,963 residents and 521,219 households at the 2022 census, next to the département figure.
Source: Insee, 2022 population census (sub-municipal files, Open Licence 2.0)
Homes.
587,480 homes, 89% of them main residences, with 4.0 rooms on average.
When main homes were built
Source: Insee, 2022 population census (sub-municipal files, Open Licence 2.0)
Income and work.
Work and qualifications at the 2022 census.
Sources: Insee, 2022 population census (sub-municipal files, Open Licence 2.0)
Health, shops and services.
Facilities and services in Bas-Rhin on 1 January 2025, from Insee’s permanent database of facilities.
Insee’s permanent database of facilities lists the shops, services and health professionals present in each commune on 1 January. Health professionals in private practice are counted one by one; several may work at the same address.
Source: Insee, permanent database of facilities 2025 (Open Licence 2.0)
Natural and industrial hazards.
Share of the département’s 514 communes exposed to each major hazard, and natural-disaster declarations since 1982.
Natural-disaster declarations by type
A natural-disaster declaration (arrêté CatNat) lets insurers pay out for the damage. The count reflects past events, not a forecast of future risk. The list of hazards comes from each département’s major-risk file; a prevention plan in force limits building in exposed zones.
Source: Géorisques, GASPAR database (Open Licence 2.0), as of 5 October 2026