Brittany
Brittany has 3,422,845 residents in 4 départements and 1,206 communes. The median price per square metre ranges from €1,930/m² in Côtes-d'Armor to €2,780/m² in Ille-et-Vilaine.
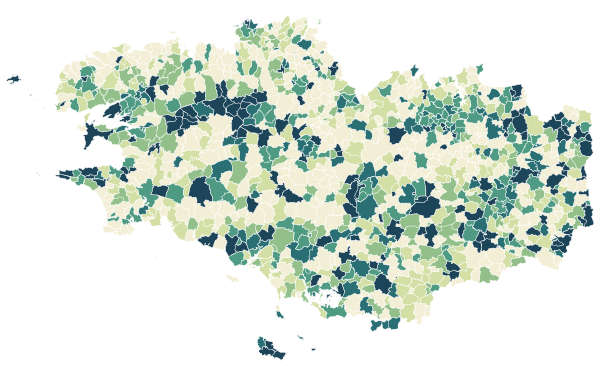
Sources: IGN and Insee, IRIS boundaries and Admin Express 2024 (Open Licence 2.0) · DGFiP property sales (DVF), data.gouv.fr statistics (Open Licence 2.0) · Insee, Filosofi 2021 income data (Open Licence 2.0) · © OpenStreetMap contributors (ODbL)
All 4 départements.
Colour shows where each département sits among the others in the region.
| Département | Residents | Communes | Price per m² | Living standard | Home owners | Aged 75+ | Unemployment | Second homes |
|---|---|---|---|---|---|---|---|---|
| Côtes-d'Armor (22) | 609,598 | 348 | €1,930/m² | – | 71% | 13% | 9.9% | 16% |
| Finistère (29) | 927,912 | 277 | €2,130/m² | – | 69% | 11% | 10.2% | 14% |
| Ille-et-Vilaine (35) | 1,109,232 | 332 | €2,780/m² | – | 60% | 9% | 9.0% | 7% |
| Morbihan (56) | 776,103 | 249 | €2,660/m² | – | 68% | 12% | 9.9% | 18% |
Sources: Insee, 2022 population census (sub-municipal files, Open Licence 2.0) · DGFiP property sales (DVF), data.gouv.fr statistics (Open Licence 2.0) · Insee, Filosofi 2021 income data (Open Licence 2.0)
People.
3,422,845 residents and 1,608,107 households at the 2022 census, next to the département figure.
Source: Insee, 2022 population census (sub-municipal files, Open Licence 2.0)
Homes.
2,011,002 homes, 80% of them main residences, with 4.4 rooms on average.
When main homes were built
Source: Insee, 2022 population census (sub-municipal files, Open Licence 2.0)
Income and work.
Work and qualifications at the 2022 census.
Sources: Insee, 2022 population census (sub-municipal files, Open Licence 2.0)
Départements in the region.
Every département has its own page, with all of its communes.