Occitania
Occitania has 6,080,731 residents in 13 départements and 4,453 communes. The median price per square metre ranges from €1,480/m² in Ariège to €3,200/m² in Hérault.
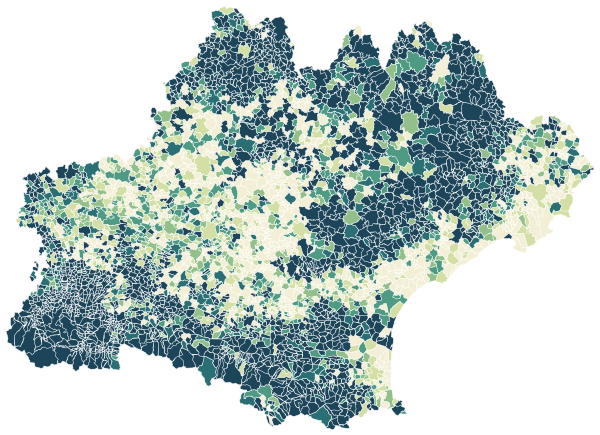
Sources: IGN and Insee, IRIS boundaries and Admin Express 2024 (Open Licence 2.0) · DGFiP property sales (DVF), data.gouv.fr statistics (Open Licence 2.0) · Insee, Filosofi 2021 income data (Open Licence 2.0) · © OpenStreetMap contributors (ODbL)
All 13 départements.
Colour shows where each département sits among the others in the region.
| Département | Residents | Communes | Price per m² | Living standard | Home owners | Aged 75+ | Unemployment | Second homes |
|---|---|---|---|---|---|---|---|---|
| Ariège (09) | 155,339 | 326 | €1,480/m² | – | 67% | 13% | 13.5% | 24% |
| Aude (11) | 377,773 | 433 | €1,900/m² | – | 63% | 13% | 15.0% | 25% |
| Aveyron (12) | 279,736 | 285 | €1,570/m² | – | 70% | 14% | 8.3% | 17% |
| Gard (30) | 764,010 | 351 | €2,480/m² | – | 60% | 11% | 14.4% | 13% |
| Gers (32) | 192,649 | 461 | €1,570/m² | – | 69% | 14% | 9.4% | 9% |
| Haute-Garonne (31) | 1,456,261 | 586 | €2,870/m² | – | 52% | 8% | 11.1% | 4% |
| Hautes-Pyrénées (65) | 231,453 | 469 | €1,690/m² | – | 65% | 14% | 11.7% | 23% |
| Hérault (34) | 1,217,331 | 342 | €3,200/m² | – | 53% | 11% | 14.8% | 17% |
| Lot (46) | 175,620 | 313 | €1,590/m² | – | 70% | 15% | 11.3% | 18% |
| Lozère (48) | 76,503 | 152 | €1,490/m² | – | 66% | 13% | 8.0% | 32% |
| Pyrénées-Orientales (66) | 492,964 | 226 | €2,420/m² | – | 60% | 13% | 16.8% | 27% |
| Tarn (81) | 396,168 | 314 | €1,720/m² | – | 67% | 13% | 11.9% | 7% |
| Tarn-et-Garonne (82) | 264,924 | 195 | €1,830/m² | – | 67% | 11% | 11.7% | 6% |
Sources: Insee, 2022 population census (sub-municipal files, Open Licence 2.0) · DGFiP property sales (DVF), data.gouv.fr statistics (Open Licence 2.0) · Insee, Filosofi 2021 income data (Open Licence 2.0)
People.
6,080,731 residents and 2,889,311 households at the 2022 census, next to the département figure.
Source: Insee, 2022 population census (sub-municipal files, Open Licence 2.0)
Homes.
3,759,703 homes, 77% of them main residences, with 4.0 rooms on average.
When main homes were built
Source: Insee, 2022 population census (sub-municipal files, Open Licence 2.0)
Income and work.
Work and qualifications at the 2022 census.
Sources: Insee, 2022 population census (sub-municipal files, Open Licence 2.0)
Départements in the region.
Every département has its own page, with all of its communes.