France
France has 67,758,665 residents excluding Mayotte, in 17 regions, 100 départements and 34,911 communes, from the mainland and Corsica to Guadeloupe, Martinique, French Guiana and Réunion. PlaceDepth covers every commune and 16,103 IRIS neighbourhoods, using data from Insee, the tax administration, the Ministry of the Interior, the Ministry of Education and OpenStreetMap.
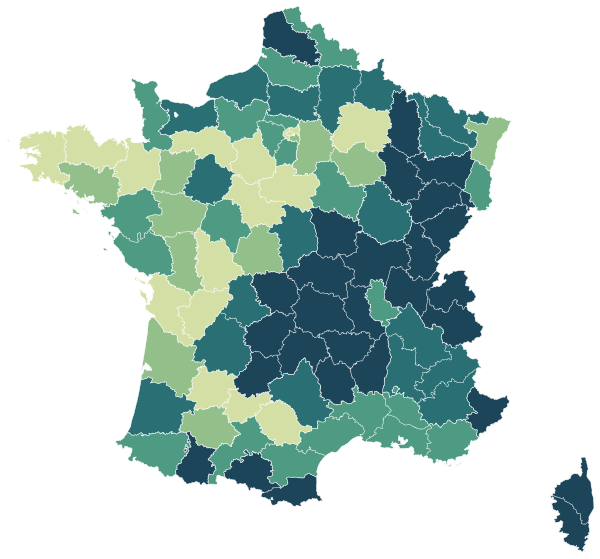
Guadeloupe, Martinique, French Guiana and Réunion each have their own map on their page.
Sources: IGN and Insee, IRIS boundaries and Admin Express 2024 (Open Licence 2.0) · DGFiP property sales (DVF), data.gouv.fr statistics (Open Licence 2.0) · Insee, Filosofi 2021 income data (Open Licence 2.0) · © OpenStreetMap contributors (ODbL)
17 regions.
Every region has its own page, with its départements.
All 100 départements.
Colour shows where each département sits among the others.
| Département | Residents | Price per m² | Living standard | Home owners | Unemployment | Second homes |
|---|---|---|---|---|---|---|
| Ain (01) | 671,289 | €2,620/m² | – | 63% | 8.9% | 6% |
| Aisne (02) | 525,558 | €1,260/m² | – | 62% | 15.8% | 3% |
| Allier (03) | 334,715 | €1,200/m² | – | 65% | 12.3% | 7% |
| Alpes-de-Haute-Provence (04) | 167,179 | €2,260/m² | – | 60% | 11.8% | 31% |
| Hautes-Alpes (05) | 141,677 | €2,690/m² | – | 62% | 9.1% | 45% |
| Alpes-Maritimes (06) | 1,114,579 | €4,730/m² | – | 55% | 11.3% | 25% |
| Ardèche (07) | 333,229 | €1,970/m² | – | 67% | 11.4% | 18% |
| Ardennes (08) | 267,204 | €1,200/m² | – | 61% | 14.8% | 4% |
| Ariège (09) | 155,339 | €1,480/m² | – | 67% | 13.5% | 24% |
| Aube (10) | 311,076 | €1,550/m² | – | 58% | 13.9% | 5% |
| Aude (11) | 377,773 | €1,900/m² | – | 63% | 15.0% | 25% |
| Aveyron (12) | 279,736 | €1,570/m² | – | 70% | 8.3% | 17% |
| Bouches-du-Rhône (13) | 2,069,811 | €3,560/m² | – | 51% | 12.0% | 5% |
| Calvados (14) | 702,697 | €2,670/m² | – | 57% | 10.5% | 18% |
| Cantal (15) | 144,399 | €1,280/m² | – | 71% | 6.9% | 21% |
| Charente (16) | 351,603 | €1,430/m² | – | 67% | 11.4% | 6% |
| Charente-Maritime (17) | 668,160 | €2,790/m² | – | 66% | 11.5% | 22% |
| Cher (18) | 299,496 | €1,210/m² | – | 68% | 12.0% | 8% |
| Corrèze (19) | 240,120 | €1,440/m² | – | 69% | 9.5% | 15% |
| Côte-d'Or (21) | 537,577 | €2,390/m² | – | 60% | 9.6% | 6% |
| Côtes-d'Armor (22) | 609,598 | €1,930/m² | – | 71% | 9.9% | 16% |
| Creuse (23) | 115,529 | €820/m² | – | 73% | 11.0% | 20% |
| Dordogne (24) | 416,325 | €1,600/m² | – | 69% | 11.8% | 14% |
| Doubs (25) | 548,662 | €2,070/m² | – | 60% | 10.6% | 4% |
| Drôme (26) | 521,432 | €2,250/m² | – | 62% | 11.8% | 8% |
| Eure (27) | 601,305 | €1,960/m² | – | 65% | 11.5% | 6% |
| Eure-et-Loir (28) | 432,950 | €1,900/m² | – | 66% | 10.8% | 6% |
| Finistère (29) | 927,912 | €2,130/m² | – | 69% | 10.2% | 14% |
| Corse-du-Sud (2A) | 166,045 | €4,090/m² | – | 56% | 8.9% | 38% |
| Haute-Corse (2B) | 185,231 | €3,120/m² | – | 55% | 10.4% | 35% |
| Gard (30) | 764,010 | €2,480/m² | – | 60% | 14.4% | 13% |
| Haute-Garonne (31) | 1,456,261 | €2,870/m² | – | 52% | 11.1% | 4% |
| Gers (32) | 192,649 | €1,570/m² | – | 69% | 9.4% | 9% |
| Gironde (33) | 1,674,980 | €3,520/m² | – | 55% | 10.6% | 9% |
| Hérault (34) | 1,217,331 | €3,200/m² | – | 53% | 14.8% | 17% |
| Ille-et-Vilaine (35) | 1,109,232 | €2,780/m² | – | 60% | 9.0% | 7% |
| Indre (36) | 216,809 | €1,050/m² | – | 69% | 11.2% | 11% |
| Indre-et-Loire (37) | 616,326 | €2,350/m² | – | 59% | 10.9% | 5% |
| Isère (38) | 1,291,380 | €2,710/m² | – | 61% | 9.5% | 8% |
| Jura (39) | 258,405 | €1,620/m² | – | 66% | 8.6% | 11% |
| Landes (40) | 428,427 | €2,690/m² | – | 67% | 11.1% | 20% |
| Loir-et-Cher (41) | 328,953 | €1,540/m² | – | 69% | 10.3% | 8% |
| Loire (42) | 772,041 | €1,600/m² | – | 59% | 11.5% | 4% |
| Haute-Loire (43) | 228,161 | €1,430/m² | – | 70% | 8.6% | 16% |
| Loire-Atlantique (44) | 1,473,156 | €3,180/m² | – | 61% | 9.4% | 10% |
| Loiret (45) | 687,063 | €1,940/m² | – | 62% | 11.3% | 5% |
| Lot (46) | 175,620 | €1,590/m² | – | 70% | 11.3% | 18% |
| Lot-et-Garonne (47) | 332,226 | €1,530/m² | – | 65% | 11.8% | 6% |
| Lozère (48) | 76,503 | €1,490/m² | – | 66% | 8.0% | 32% |
| Maine-et-Loire (49) | 828,151 | €2,190/m² | – | 61% | 9.8% | 3% |
| Manche (50) | 496,815 | €1,880/m² | – | 64% | 8.7% | 15% |
| Marne (51) | 564,107 | €2,130/m² | – | 52% | 11.8% | 4% |
| Haute-Marne (52) | 169,865 | €980/m² | – | 65% | 11.5% | 8% |
| Mayenne (53) | 305,437 | €1,510/m² | – | 67% | 7.6% | 5% |
| Meurthe-et-Moselle (54) | 732,898 | €1,920/m² | – | 58% | 11.6% | 2% |
| Meuse (55) | 180,745 | €1,050/m² | – | 68% | 11.4% | 5% |
| Morbihan (56) | 776,103 | €2,660/m² | – | 68% | 9.9% | 18% |
| Moselle (57) | 1,050,721 | – | – | 60% | 11.3% | 2% |
| Nièvre (58) | 202,299 | €1,010/m² | – | 68% | 11.6% | 15% |
| Nord (59) | 2,616,909 | €2,130/m² | – | 54% | 14.9% | 2% |
| Oise (60) | 830,725 | €2,280/m² | – | 61% | 12.0% | 2% |
| Orne (61) | 276,144 | €1,310/m² | – | 64% | 11.2% | 11% |
| Pas-de-Calais (62) | 1,460,184 | €1,760/m² | – | 58% | 14.1% | 7% |
| Puy-de-Dôme (63) | 664,385 | €1,950/m² | – | 62% | 10.1% | 10% |
| Pyrénées-Atlantiques (64) | 699,473 | €2,780/m² | – | 61% | 10.1% | 13% |
| Hautes-Pyrénées (65) | 231,453 | €1,690/m² | – | 65% | 11.7% | 23% |
| Pyrénées-Orientales (66) | 492,964 | €2,420/m² | – | 60% | 16.8% | 27% |
| Bas-Rhin (67) | 1,156,963 | – | – | 56% | 10.3% | 3% |
| Haut-Rhin (68) | 767,800 | – | – | 61% | 11.6% | 4% |
| Rhône (69) | 1,907,982 | €3,910/m² | – | 49% | 10.8% | 4% |
| Haute-Saône (70) | 233,920 | €1,150/m² | – | 69% | 10.3% | 6% |
| Saône-et-Loire (71) | 549,136 | €1,450/m² | – | 65% | 10.3% | 7% |
| Sarthe (72) | 566,129 | €1,630/m² | – | 65% | 10.8% | 5% |
| Savoie (73) | 445,288 | €3,600/m² | – | 60% | 7.7% | 37% |
| Haute-Savoie (74) | 849,583 | €4,400/m² | – | 60% | 8.5% | 24% |
| Paris (75) | 2,113,705 | €10,130/m² | – | 33% | 10.5% | 10% |
| Seine-Maritime (76) | 1,260,205 | €2,180/m² | – | 53% | 13.0% | 4% |
| Seine-et-Marne (77) | 1,452,399 | €3,210/m² | – | 62% | 10.5% | 3% |
| Yvelines (78) | 1,470,778 | €4,010/m² | – | 58% | 9.6% | 3% |
| Deux-Sèvres (79) | 375,415 | €1,370/m² | – | 70% | 8.8% | 5% |
| Somme (80) | 565,540 | €1,810/m² | – | 60% | 13.7% | 9% |
| Tarn (81) | 396,168 | €1,720/m² | – | 67% | 11.9% | 7% |
| Tarn-et-Garonne (82) | 264,924 | €1,830/m² | – | 67% | 11.7% | 6% |
| Var (83) | 1,108,364 | €3,930/m² | – | 59% | 12.1% | 24% |
| Vaucluse (84) | 568,702 | €2,640/m² | – | 56% | 13.9% | 9% |
| Vendée (85) | 706,343 | €2,470/m² | – | 72% | 8.6% | 23% |
| Vienne (86) | 438,688 | €1,560/m² | – | 62% | 10.6% | 6% |
| Haute-Vienne (87) | 372,438 | €1,500/m² | – | 63% | 11.1% | 8% |
| Vosges (88) | 358,700 | €1,340/m² | – | 64% | 12.4% | 10% |
| Yonne (89) | 333,896 | €1,380/m² | – | 67% | 11.6% | 11% |
| Territoire de Belfort (90) | 140,082 | €1,490/m² | – | 56% | 13.1% | 2% |
| Essonne (91) | 1,324,546 | €3,310/m² | – | 58% | 10.1% | 2% |
| Hauts-de-Seine (92) | 1,647,435 | €6,860/m² | – | 43% | 10.0% | 4% |
| Seine-Saint-Denis (93) | 1,681,725 | €4,130/m² | – | 38% | 15.8% | 1% |
| Val-de-Marne (94) | 1,419,531 | €5,000/m² | – | 44% | 11.6% | 2% |
| Val-d'Oise (95) | 1,270,845 | €3,540/m² | – | 55% | 11.9% | 2% |
| Guadeloupe (971) | 383,569 | €2,990/m² | – | 59% | 25.2% | 11% |
| Martinique (972) | 361,019 | €2,750/m² | – | 54% | 19.6% | 7% |
| Guyane (973) | 288,382 | €2,630/m² | – | 40% | 30.2% | 4% |
| La Réunion (974) | 881,348 | €2,740/m² | – | 50% | 28.9% | 4% |
Sources: Insee, 2022 population census (sub-municipal files, Open Licence 2.0) · DGFiP property sales (DVF), data.gouv.fr statistics (Open Licence 2.0) · Insee, Filosofi 2021 income data (Open Licence 2.0)
People.
67,758,665 residents and 30,906,531 households at the 2022 census.
Source: Insee, 2022 population census (sub-municipal files, Open Licence 2.0)
Homes.
37,527,031 homes, 82% of them main residences, with 4.0 rooms on average.
When main homes were built
Source: Insee, 2022 population census (sub-municipal files, Open Licence 2.0)
Property prices.
4,376,532 house and flat sales over five years.
Median prices from sales published in France’s Demandes de valeurs foncières (DVF) over ten half-years, for sales of a single property. Individual sales are not shown. A median is only given where there were at least ten sales.
Source: DGFiP property sales (DVF), data.gouv.fr statistics (Open Licence 2.0)
Income and work.
Work and qualifications at the 2022 census.
Sources: Insee, 2022 population census (sub-municipal files, Open Licence 2.0)